

Our team of market analysts have a singular mission: to help you make better investment decisions. Read the latest market commentary.
Continue readingOur team of market analysts have a singular mission: to help you make better investment decisions. Read the latest market commentary.
Continue readingOur team of market analysts have a singular mission: to help you make better investment decisions. Read the latest market commentary.
Continue readingOur team of market analysts have a singular mission: to help you make better investment decisions. Read the latest market commentary.
Continue readingOur team of market analysts have a singular mission: to help you make better investment decisions. Read the latest market commentary.
Continue readingOur team of market analysts have a singular mission: to help you make better investment decisions. Read the latest market commentary.
Continue readingOur team of market analysts have a singular mission: to help you make better investment decisions. Read the latest market commentary.
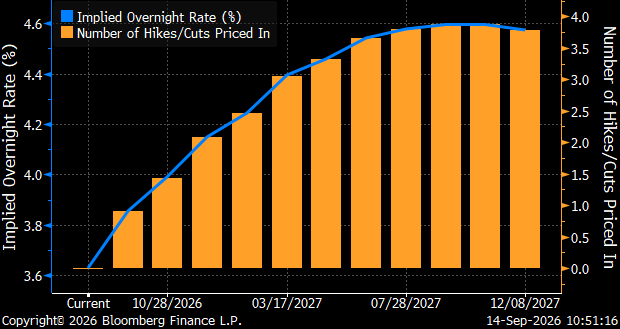
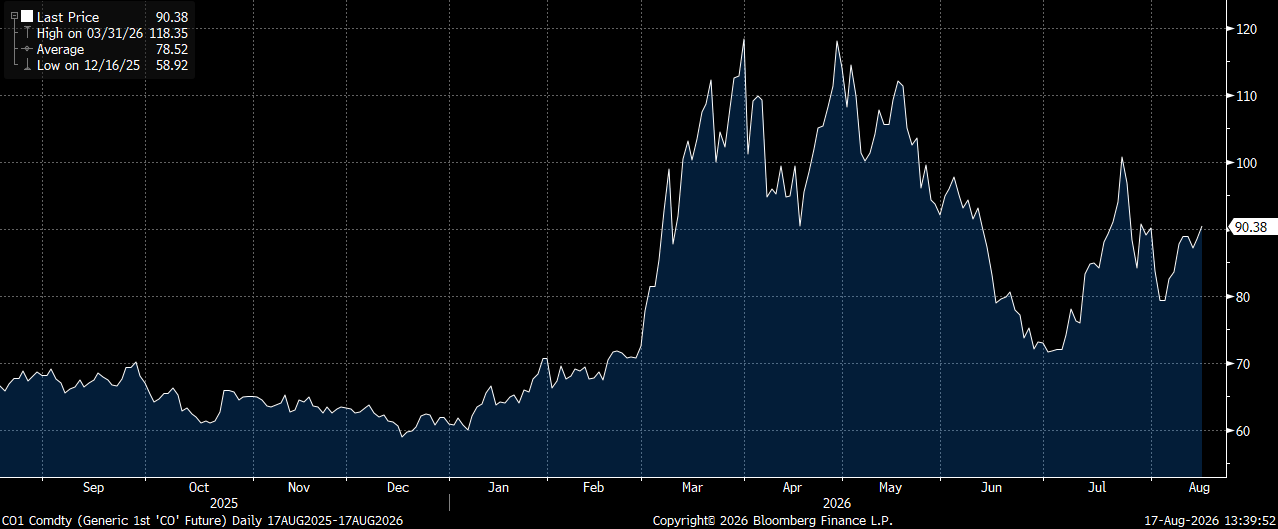
Continue readingLast week’s CPI data, which surprised markets with a bigger-than-expected increase in prices, has increased the conviction of investors that the Fed needs to hike rates to maintain credibility. Despite Federal Reserve Chairman Warsh’s recent speech at the Jackson Hole symposium, markets are continuing to seek clues regarding the Fed’s plan to bring inflation back to its 2% target. Warsh’s comments were received by the markets as hawkish and have prompted increased bets on a September rate hike. This morning, Fed funds futures are now pricing in the likelihood of a Fed rate hike of 25bp at over 90% for the Fed’s meeting later this week. Furthermore, renewed aggression in Iran is placing upward pressure on oil prices with ICE Brent Futures now approaching $110 per barrel, leading to further speculation about inflation and pushing 10-year Treasury yields to over 5%.
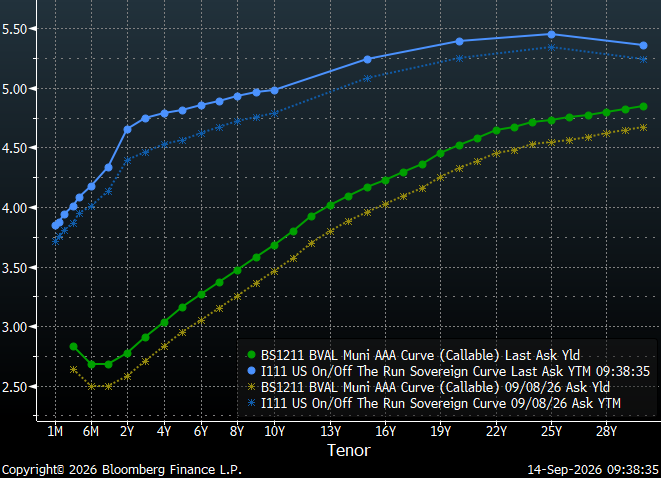
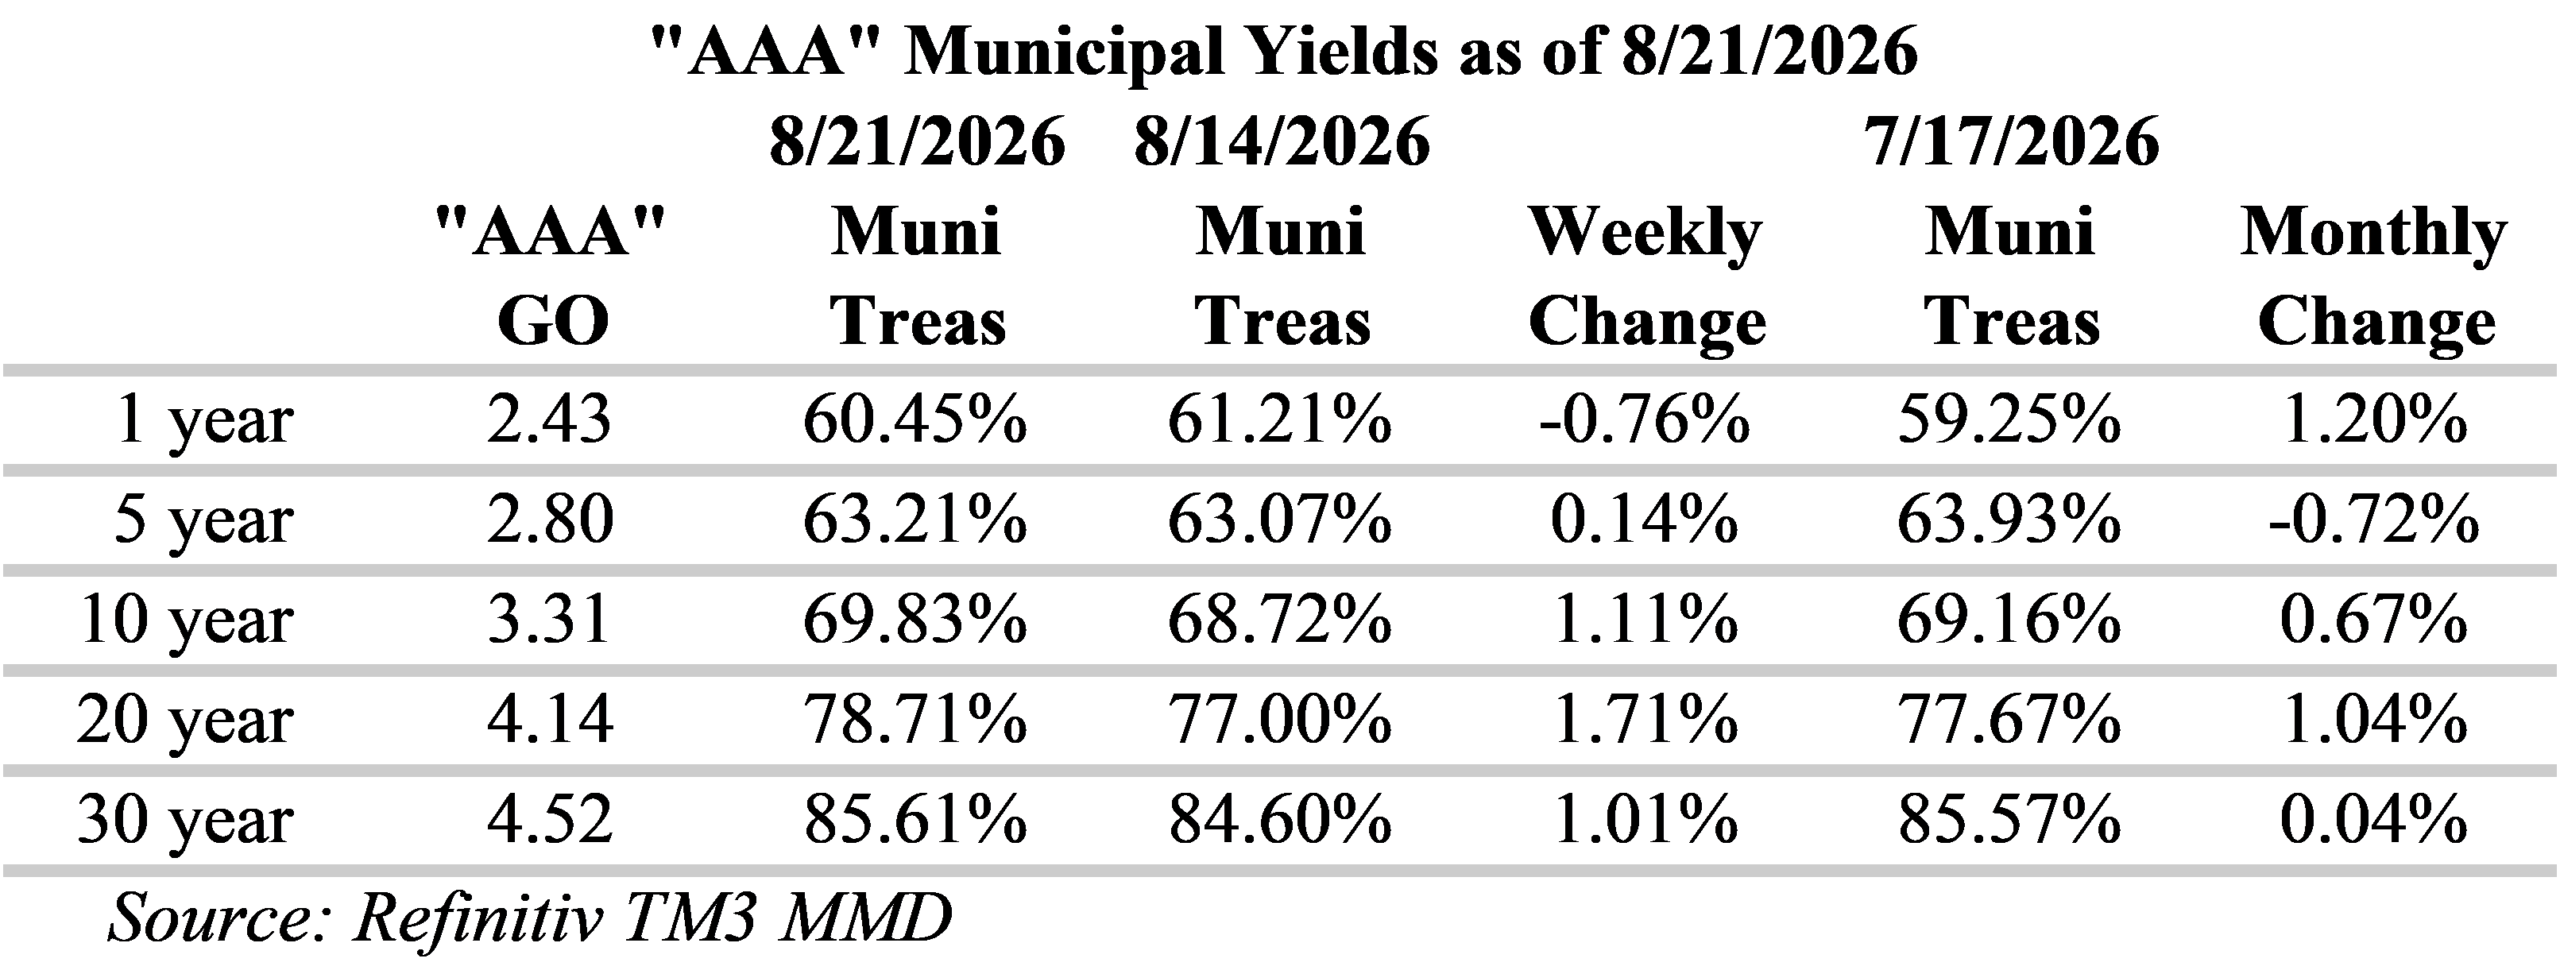
Over this past week, the Treasury curve shifted higher, with the biggest moves around the policy sensitive two-year tenor. Muni yields have moved in a more uniform fashion, with a parallel shift upward of approximately 20 basis points. Inflation fears continue to place upward pressure on longer yields while the anticipation of higher rates from the Fed prop-up yields on the short-end of the yield curve. Despite inflation concerns, the slope at the long-end of the municipal yield curve, past 20-years, remains relatively flat with a total slope of 27 bps from 21-30-years. Due to this flat tail, municipal bond investors can currently buy 20-year maturities that yield over 93% of the 30-year curve.
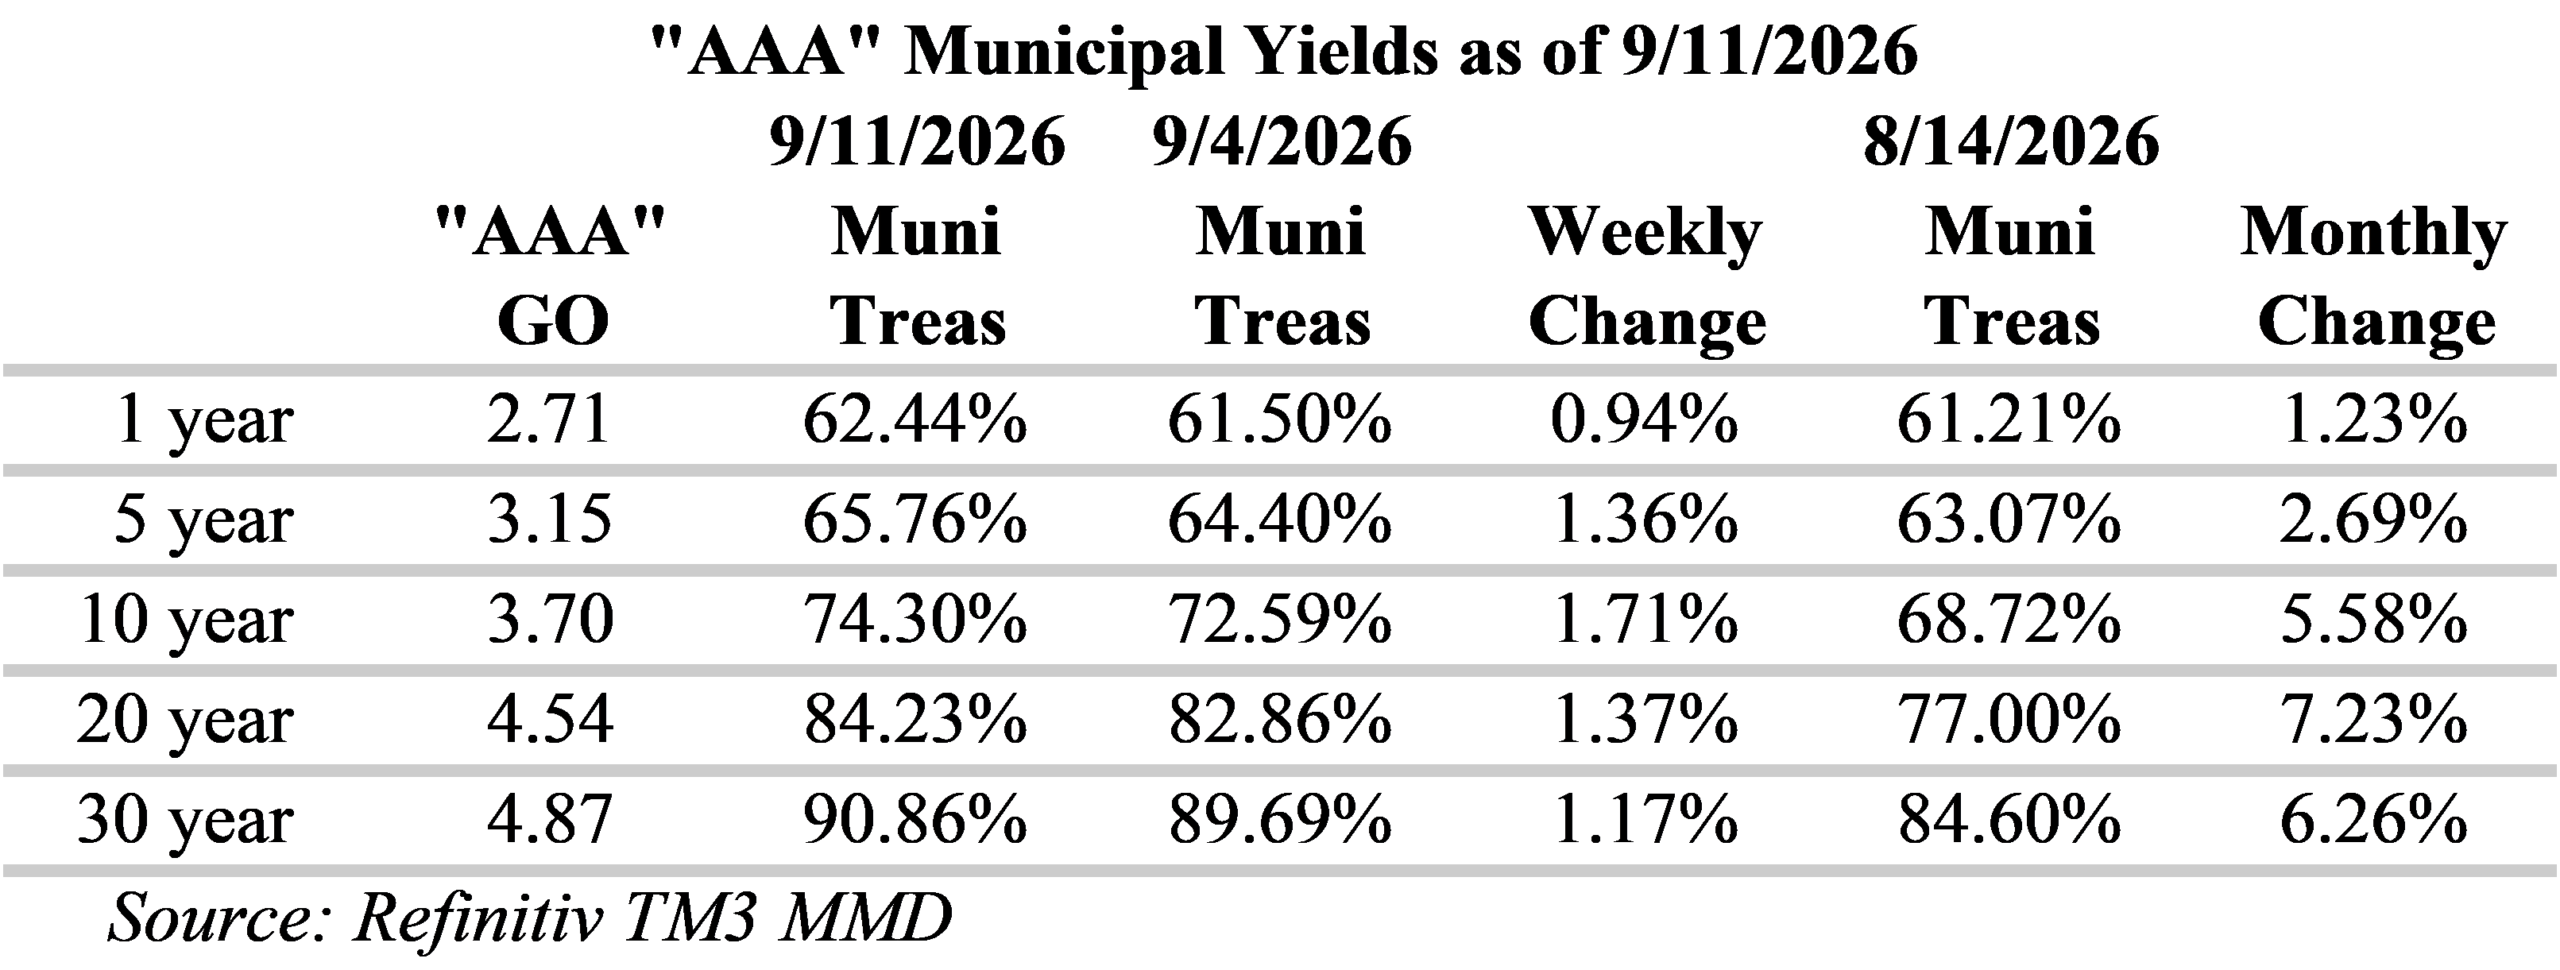
Municipal/Treasury ratios generally increased (cheaper) over this past week, with the largest changes occurring around the 10-year tenor. One-year ratios have now moved decisively over 60%, 10-year ratios are now well over 70% of Treasuries and, due to significant cheapening last week, 20-year ratios are approaching 85%. Investors seeking to maximize curve positioning with relative value can now go to the 14-year tenor and capture over 85% of the 30-year municipal curve with less than half the maturity extension. Furthermore, ratios in this part of the curve are now significantly more appealing at approximately 75% of Treasuries. Flattening further out the curve has made extending maturities less rewarding, but ratios are cheaper with investors capturing over 90% of Treasuries at 30-years. Although, the yield curve is very flat over these longer tenors with just two to three basis points of slope for maturities past 23-years.
Approximately $10.2 billion in new issues are expected to sell in the municipal market this week. Notable deals include: State of New Jersey, which plans to sell $1.67 billion of bonds; Northwell Health Obligated Group has scheduled $734.6 million; County of Hillsborough FL Water & Wastewater Revenue is expected to offer $623.4 million; and, University Health Systems of Eastern Carolina Inc Obligated Group is scheduled to bring $431.1 million to the market. Last week, investors added approximately $193 million to municipal bond mutual funds, up from $138 million the prior week, according to LSEG Lipper data. Furthermore, redemptions and maturities in the next 30-days are expected to total $23.4 billion, according to data compiled by Bloomberg.
Herbert J. Sims & Co. Inc. is a SEC registered broker-dealer, a member of FINRA, SIPC. The information contained herein has been prepared based upon publicly available sources believed to be reliable; however, HJ Sims does not warrant its completeness or accuracy and no independent verification has been made as to its accuracy or completeness. The information contained has been prepared and is distributed solely for informational purposes and is not a solicitation or an offer to buy or sell any security or instrument or to participate in any trading or investment strategy, and is subject to change without notice. All investments include risks. Nothing in this message or report constitutes or should be construed to be accounting, tax, investment or legal advice.
Our team of market analysts have a singular mission: to help you make better investment decisions. Read the latest market commentary.
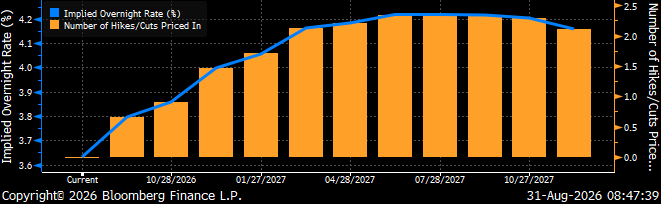
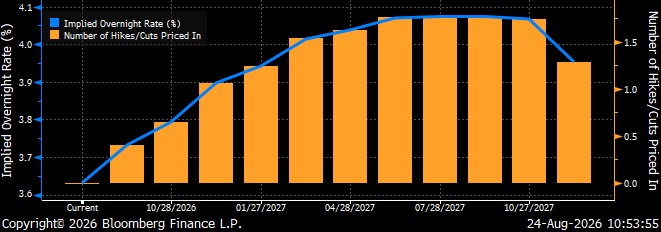
Continue readingLast week, the capital markets were focused on the Federal Reserve Bank of Kansas City’s annual economic symposium in Jackson Hole, Wyoming. The markets were seeking clarity on the Fed’s economic outlook and looking for clues about its strategy to bring inflation back to target. Although Chairman Warsh did not reveal much, he did reiterate that curbing inflation is the central bank’s top priority and that inflation is not slowing meaningfully. Chairman Warsh also described interest rates as the Fed’s “predominant tool” for controlling inflation. These comments were received by the markets as hawkish and have prompted increased bets on a September rate hike. This morning, Fed funds futures are now pricing in the likelihood of a Fed rate hike of 25bp at over 90% by the October 27-28 meeting. To compound matters, renewed aggression in Iran is placing upward pressure on oil prices leading to further speculation about inflation.
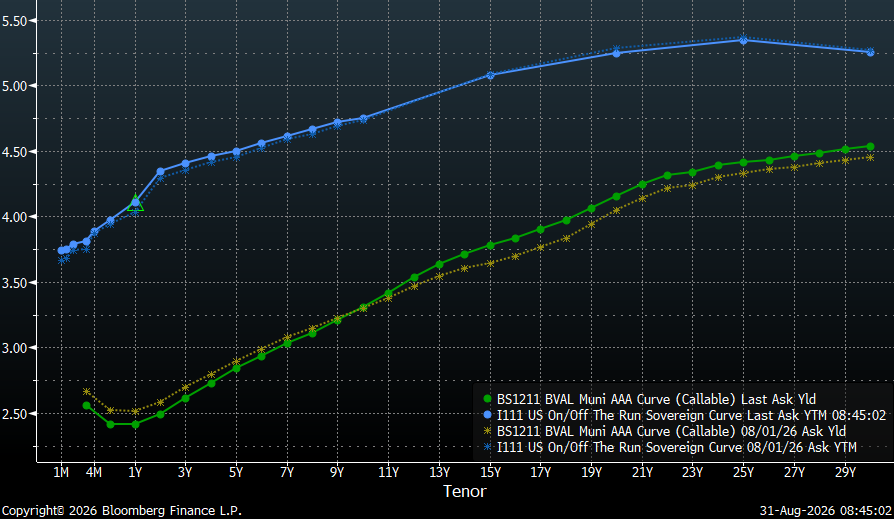
Over this past month, the Treasury curve is largely unchanged, flattened slightly with one-month yields increasing approximately 7 bps and 30-year yields dropping approximately three bps. Muni yields, however, have moved in the opposite direction with a steepening yield curve as long yields sold-off approximately ten basis points and three-month yields rallied a little over four bps. The muni curve rotated around the ten-year tenor with maturities past ten years selling-off and and maturities shorter than ten years rallying. The largest moves in municipals were in the 15-20-year tenors with yields increasing roughly 15bps as heavy issuance, economic uncertainty and inflation fears placed upward pressure on longer yields. Despite these concerns, the slope at the long-end of the municipal yield curve, past 20-years, remains relatively flat with a total slope of 29 bps from 21-30-years. Due to this flat tail, municipal bond investors can currently buy 20-year maturities that yield 91% of the 30-year curve versus 73% for 10-year maturities.
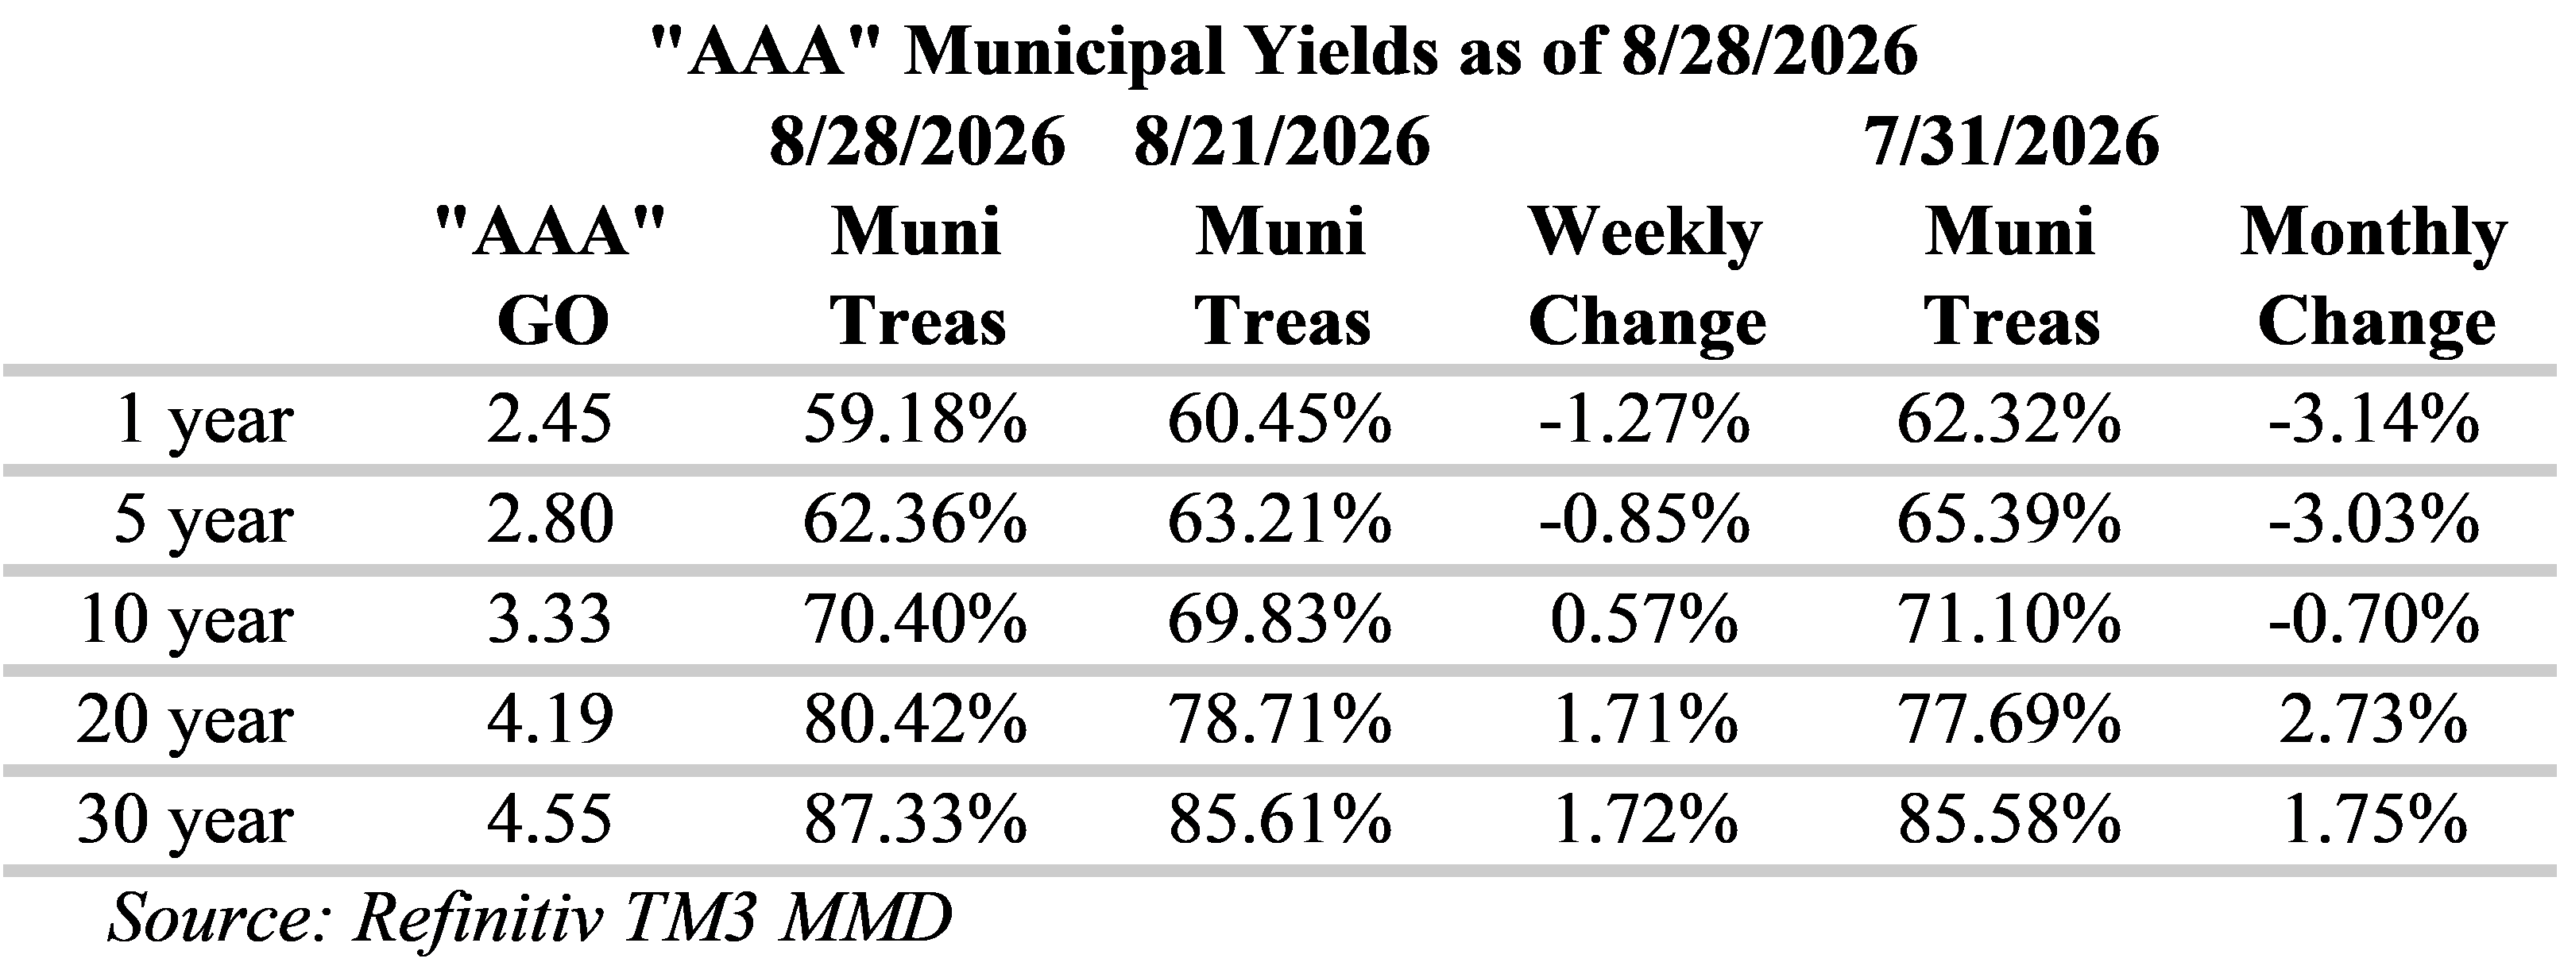
Municipal/Treasury ratios generally increased (cheaper) for maturities past 5-years this past week, with the largest changes occurring past the 20-year tenor. One-year ratios have again dipped below 60%, 10-year ratios tipped over 70% of Treasuries and, due to significant cheapening last week, 20-year ratios are again over 80%. Investors seeking to maximize curve positioning with relative value can now go to the 14-year tenor and capture almost 85% of the 30-year municipal curve with less than half the maturity extension. However, ratios in this part of the curve continue to be a challenge at close to 70% of Treasuries. Flattening further out the curve has made extending maturities less rewarding, but ratios are cheaper with investors capturing over 87% of Treasuries at 30-years. Although, the yield curve is very flat over these longer tenors with just two to three basis points of slope for maturities past 23-years.
The Municipal the new issue calendar picks-up this week from $12.9 billion last week to $15.8 billion. Notable deals include: State of New York Sales Tax Revenue Bonds with $1.93 billion, Salt River Project Agricultural Improvement & Power District has scheduled $1.35 billion, Chicago O’Hare International Airport is expected to offer $1.31 billion and Texas Transportation Commission has $1.12 billion on the calendar. Last week, investors added approximately $1.4 billion to municipal bond mutual funds, up from $838 million the prior week, according to LSEG Lipper data. Furthermore, redemptions and maturities in the next 30-days are expected to total $20.1 billion, according to data compiled by Bloomberg.
Herbert J. Sims & Co. Inc. is a SEC registered broker-dealer, a member of FINRA, SIPC. The information contained herein has been prepared based upon publicly available sources believed to be reliable; however, HJ Sims does not warrant its completeness or accuracy and no independent verification has been made as to its accuracy or completeness. The information contained has been prepared and is distributed solely for informational purposes and is not a solicitation or an offer to buy or sell any security or instrument or to participate in any trading or investment strategy, and is subject to change without notice. All investments include risks. Nothing in this message or report constitutes or should be construed to be accounting, tax, investment or legal advice.
Our team of market analysts have a singular mission: to help you make better investment decisions. Read the latest market commentary.
Continue readingLast Wednesday, the Treasury Department announced that it would increase buybacks of long-term bonds through its extended debt repurchase program. The announcement was made after long-term Treasury yields hit the highest levels we have seen on nearly 20-years. The move initially prompted a Treasury market rally, however Treasuries later sold-off as the market questioned the potential impact of increasing buyback operations from $2 billion to at least $4 billion in the $31.5 trillion Treasury market. Furthermore, investors remain cautious amid stubbornly high inflation, mounting federal debt, and a new Federal Reserve chairman inclined to remain quiet. Fed funds futures are now pricing in the likelihood of a Fed rate hike of 25bp at over 100% by the December 8-9 meeting; which, as of earlier this month, was thought to occur as soon as October. Furthermore, this week bond traders will be paying attention to the GDP and personal consumption expenditures price index on Wednesday and Kevin Warsh’s first Jackson Hole Economic Policy Summit as Fed Chairman.
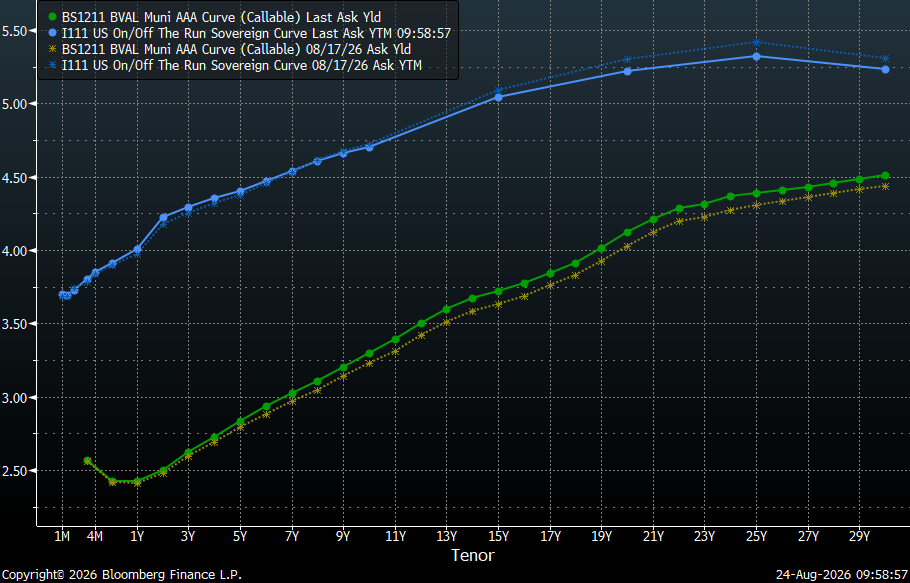
Over this past week, the Treasury curve experienced a rally on the long-end while municipal bonds sold-off for periods past 4-years. Recent issuance trends and adjustments to yield slopes have resulted in the intermediate portion of the municipal yield curve having more slope. While inflation concerns, driven by volatile energy prices, continue to hold the long-end of the Treasury curve above 5% for maturities past 15-years. The slope at the long-end of the municipal yield curve, past 20-years, remains relatively flat with a total slope of 28 bps from 21-30-years. Due to this flat tail, municipal bond investors can currently buy 20-year maturities that yield 91% of the 30-year curve versus 73% for 10-year maturities.
Not surprisingly, municipal/Treasury ratios have generally increased (cheaper) this past week, with the largest changes occurring around the 20-year tenor. One-year ratios continue to hover over 60%, 10-year ratios remain just under 70% of Treasuries and, despite significant cheapening last week, 20-year ratios remain just below 80%. Investors seeking to maximize curve positioning with relative value can now go to the 13-year tenor and capture over 80% of the 30-year municipal curve. However, ratios in this part of the curve continue to be a challenge at approximately 70% of Treasuries. Flattening further out the curve has made extending maturities less rewarding, but ratios are cheaper with investors capturing over 85% of Treasuries at 30-years. Although, the yield curve is very flat over these longer tenors with just two to three basis points of slope for maturities past 23-years.
The Municipal the new issue calendar drops this week from $17.4 billion last week to a more palatable, but still robust $12.9 billion. Notable deals include: the City of Portland, which plans to sell $585.6 million of water system revenue bonds; the Commonwealth of Pennsylvania has scheduled $533.6 million; City of San Antonio, Texas is expected to offer $488 million; and, Pennsylvania State University is on the calendar with $458.4 million. Last week, investors added approximately $838 million to municipal bond mutual funds, up from $758 million the prior week, according to LSEG Lipper data. Furthermore, redemptions and maturities in the next 30-days are expected to total $22.5 billion, according to data compiled by Bloomberg. Overall, investors continue to support munis but opportunities along the yield curve are currently favoring shorter strategies.
Herbert J. Sims & Co. Inc. is a SEC registered broker-dealer, a member of FINRA, SIPC. The information contained herein has been prepared based upon publicly available sources believed to be reliable; however, HJ Sims does not warrant its completeness or accuracy and no independent verification has been made as to its accuracy or completeness. The information contained has been prepared and is distributed solely for informational purposes and is not a solicitation or an offer to buy or sell any security or instrument or to participate in any trading or investment strategy, and is subject to change without notice. All investments include risks. Nothing in this message or report constitutes or should be construed to be accounting, tax, investment or legal advice.
The yield on 30-year Treasuries hit the highest level since 2007 today as investors struggle with inflationary pressures amid inflation that has exceeded the Fed’s target 2% rate for the past five-years. Although both CPI and PPI prints from last week were better than economists had forecast, surging government spending amid stubborn inflation and faint prospects of peace in Iran have markets nervous. In addition, energy prices continue to creep-up, with restricted oil traffic through the Strait of Hormuz. ICE Brent Futures are now back in the low $90’s. Furthermore, the last Fed meeting has left many market participants unconvinced of the Fed’s commitment to fighting inflation. The impression of a stable labor market combined with elevated energy prices continues to sustain a narrative for Fed rate hikes later this year. Fed funds futures are now pricing in the likelihood of a Fed rate hike of 25bp at 96% by the December 8-9 meeting; which, as of earlier this month, was thought to occur as soon as October.
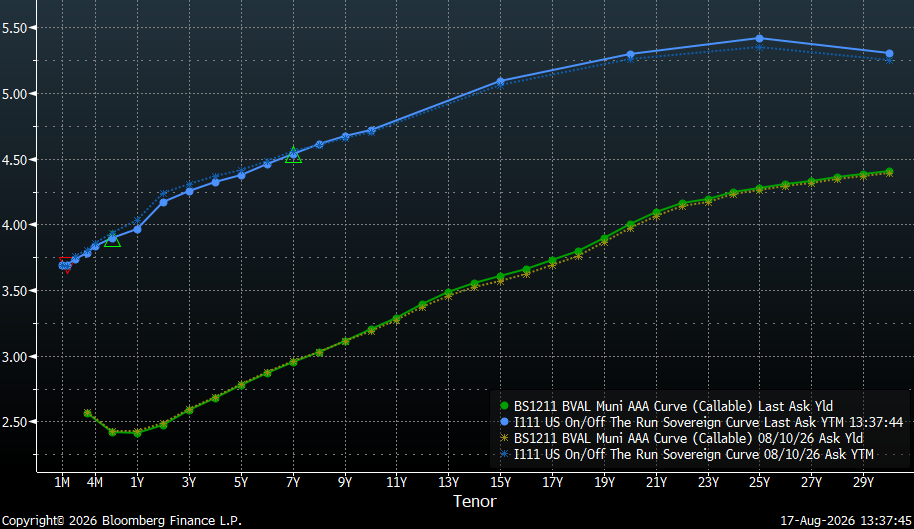
Over this past week, the Treasury curve is relatively unchanged, with some movement around the policy sensitive two-year tenor and some inflation fueled steepening on the long-end. By comparison, municipal yields have been more stable with ratios driving yields up a bit around the 15 to 20-year tenors. Inflation concerns with volatile energy prices continue to hold the long-end of the Treasury curve above 5% for maturities past 15-years. The slope at the long-end of the municipal yield curve, past 20-years, remains relatively flat with a total slope of 30 bps from 21-30-years. Due to this flat tail, municipal bond investors can currently buy 20-year maturities that yield 91% of the 30-year curve versus 73% for 10-year maturities.
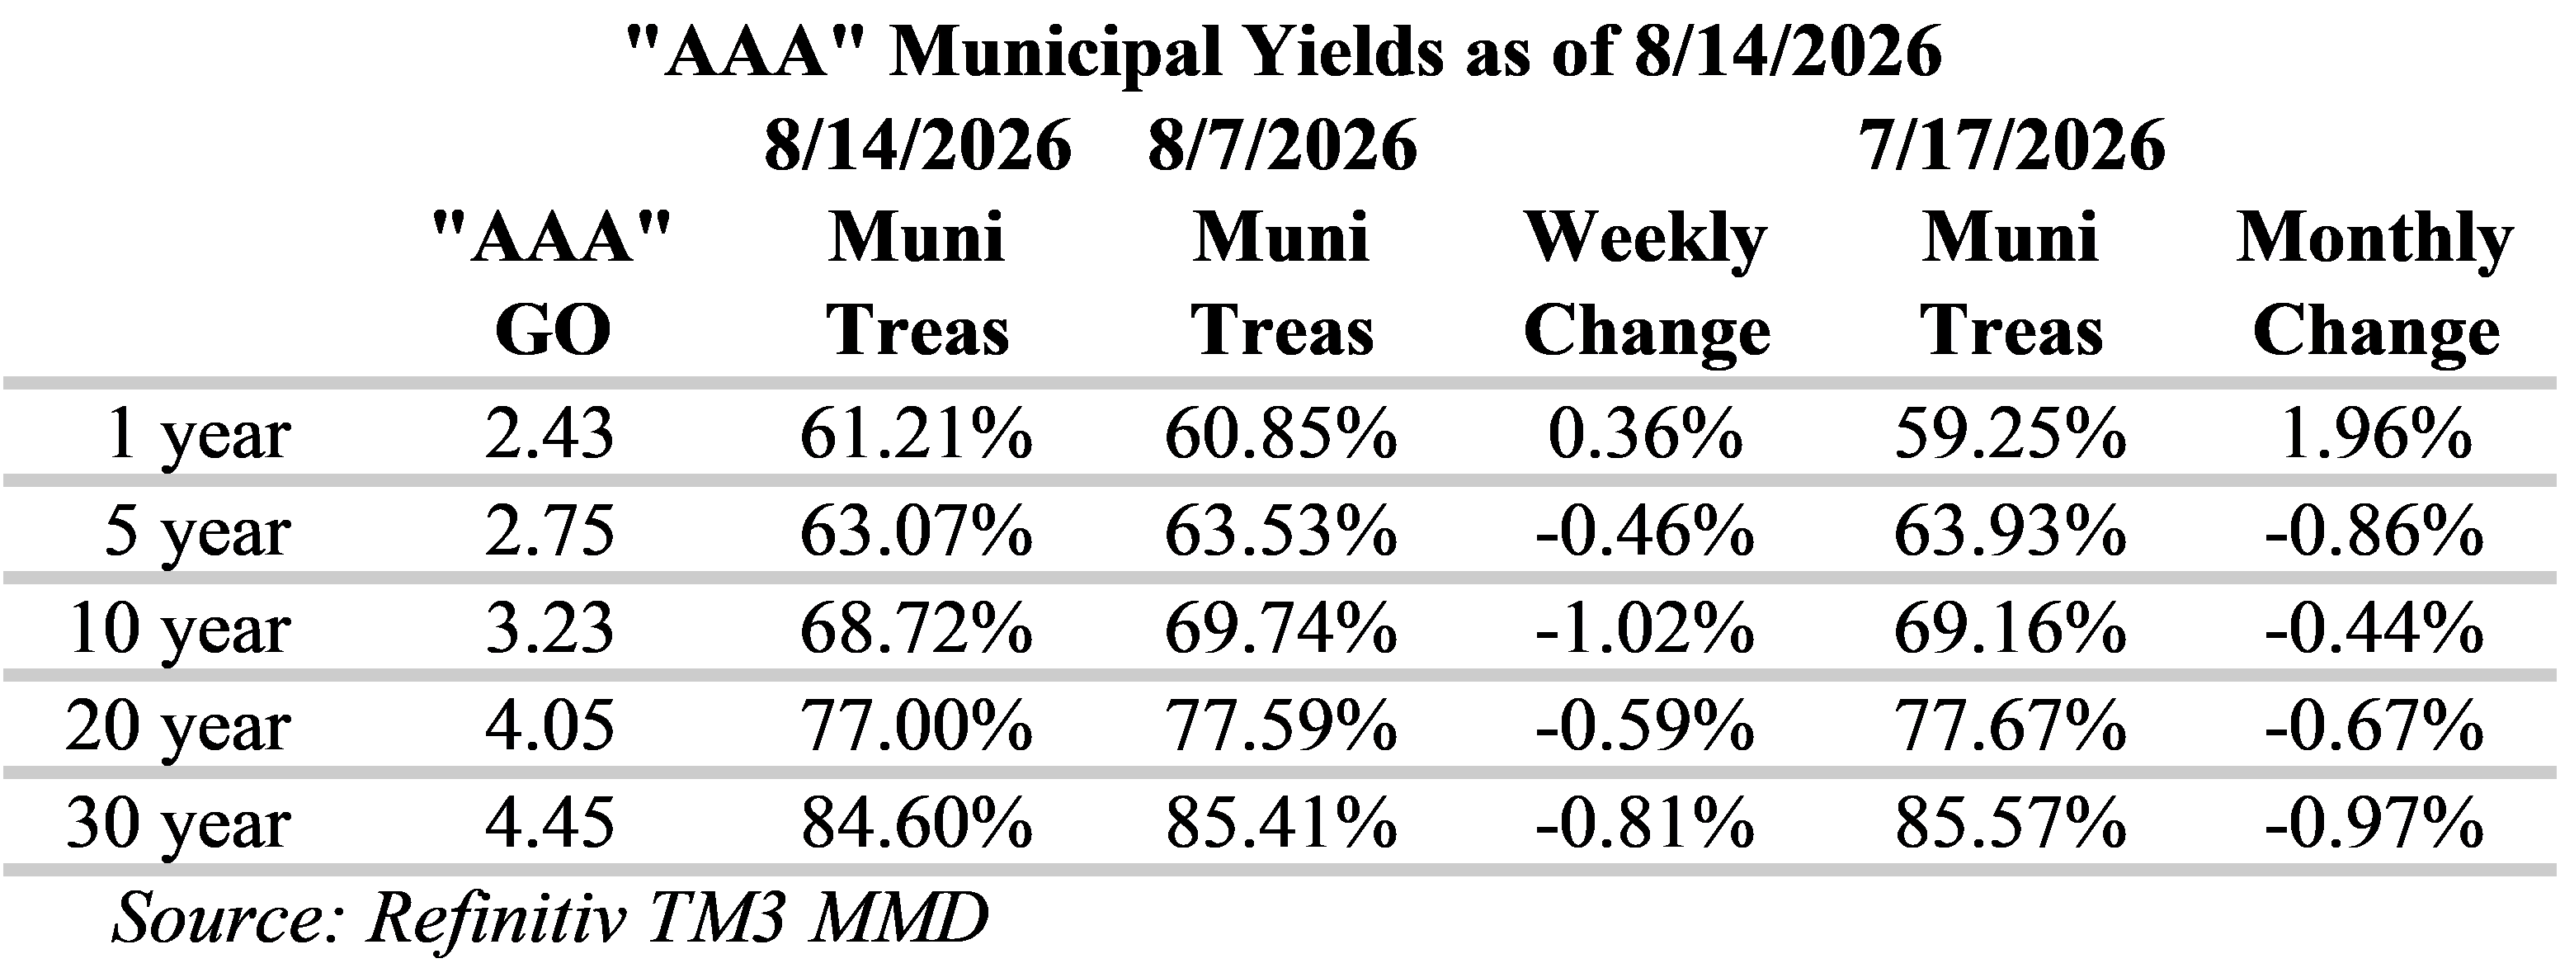
Municipal/Treasury ratios have generally declined (richer) this past week, with the largest changes occurring around the 10-year tenor. One-year ratios are now just above 60% and 10-year ratios remain under 70% of Treasuries and 20-year ratios remain just below 80%. Recent adjustments to yield slopes have resulted in the intermediate portion of the yield curve having more slope. Investors seeking to maximize curve positioning with relative value can now go to the 13-year tenor and capture approximately 80% of the 30-year municipal curve. However, ratios in this part of the curve continue to be a challenge at approximately 70% of Treasuries. Flattening further out the curve has made extending maturities less rewarding, but ratios are cheaper with investors capturing 85% of Treasuries at 30-years. Although, the yield curve is very flat over these longer tenors with just two to three basis points of slope for maturities past 23-years.
The Municipal the new issue calendar ramps-up again this week with US state and local governments expected to sell around $17.4 billion of bonds. Notable deals include: the City of Los Angeles Department of Airports with $2.71 billion; New York City Transitional Finance Authority Future Tax Secured Revenue has scheduled $1.92 billion; State of Michigan Trunk Line Revenue is expected to offer $706.4 million; and, Los Angeles County Metropolitan Transportation Authority is scheduled to bring $530.6 million to market. Last week, investors added approximately $758 million to municipal bond mutual funds, down from $1.3 billion the prior week, according to LSEG Lipper data. Furthermore, redemptions and maturities in the next 30-days are expected to total $24.3 billion, according to data compiled by Bloomberg. Overall, investors continue to support munis but relative value versus Treasuries is becoming a more significant factor.
Herbert J. Sims & Co. Inc. is a SEC registered broker-dealer, a member of FINRA, SIPC. The information contained herein has been prepared based upon publicly available sources believed to be reliable; however, HJ Sims does not warrant its completeness or accuracy and no independent verification has been made as to its accuracy or completeness. The information contained has been prepared and is distributed solely for informational purposes and is not a solicitation or an offer to buy or sell any security or instrument or to participate in any trading or investment strategy, and is subject to change without notice. All investments include risks. Nothing in this message or report constitutes or should be construed to be accounting, tax, investment or legal advice.
Our team of market analysts have a singular mission: to help you make better investment decisions. Read the latest market commentary.
Continue readingOur team of market analysts have a singular mission: to help you make better investment decisions. Read the latest market commentary.
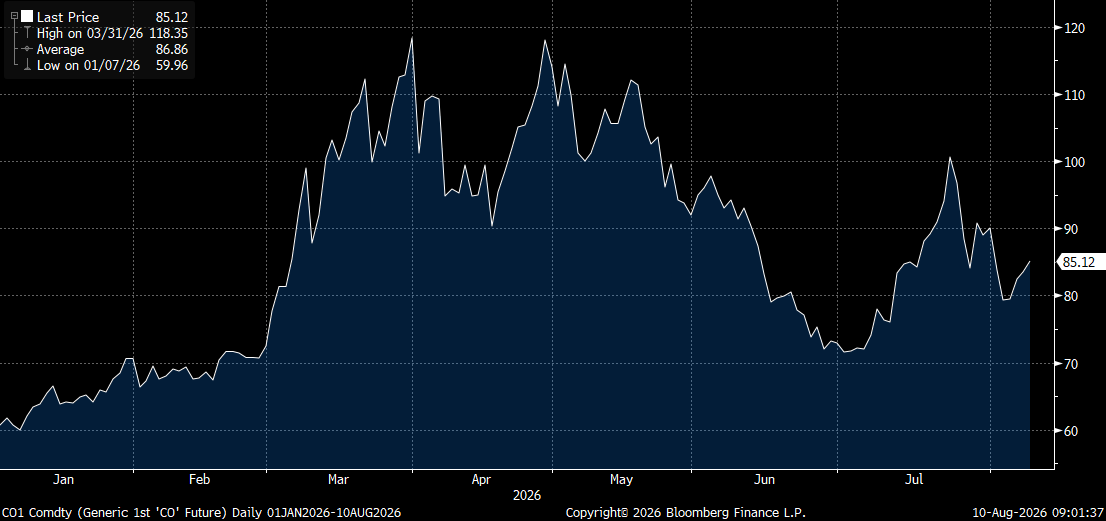
Continue readingStalled negotiations in Iran and economic uncertainty have the Treasury market selling-off slightly this morning. After dropping below $80 last week, ICE Brent Futures are now back in the mid $80’s this morning as anxieties in the capital markets regarding recent energy fueled inflation remain elevated. In addition, CPI and PPI are both anticipated to be higher when they are released later this week. The last Fed meeting also left many market participants unconvinced of the Fed’s commitment to fighting inflation. The impression of a stable labor market combined with elevated energy prices continues to sustain a narrative for Fed rate hikes later this year. Fed funds futures are now pricing in the likelihood of a Fed rate hike of 25bp at over 100% by the December 8-9 meeting; which, as of early last week, was thought to occur as soon as October.
Over this past week, the Treasury curve was relatively unchanged while the municipal curve experienced a notable downward parallel shift. This outperformance in munis is largely related to technical factors, such as recent inflows combined with bond maturities and calls. Furthermore, the new issue municipal calendar, despite being elevated, witnessed underwriting scales being bumped to lower yields with new issues strongly received by the market. Inflation concerns with volatile energy prices continue to hold the long-end of the Treasury curve above 5% for maturities past 15-years. The slope at the long-end of the municipal yield curve, past 20-years, remains relatively flat with a total slope of 30 bps from 21-30-years. Due to this flat tail, municipal bond investors can currently buy 20-year maturities that yield 91% of the 30-year curve versus 73% for 10-year maturities.
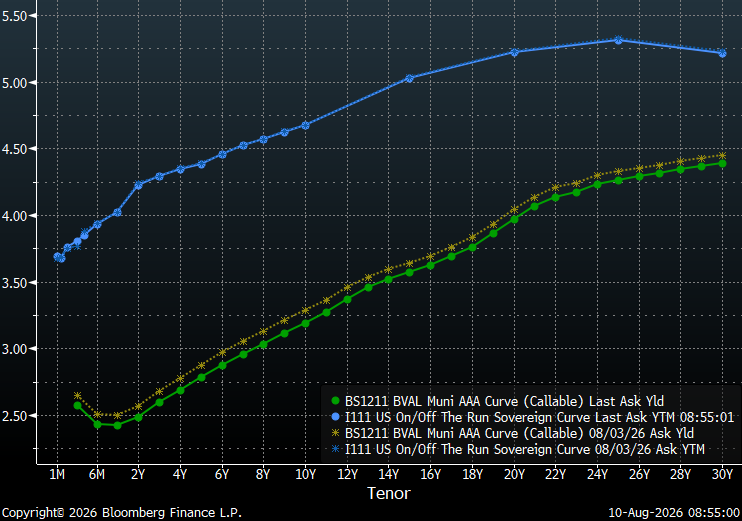
Over the past week, Municipal/Treasury ratios have generally declined (richer), with the largest changes occurring around the five-year tenor. However, over the past month we have seen a notable cheapening in ratios, particularly at the short-end of the curve as the market assesses the possibility of the Fed raising rates. One-year ratios are now just above 60% and 10-year ratios are now slightly under 70% of Treasuries and 20-year ratios remain just below 80%. Recent adjustments to yield slopes have resulted in the intermediate portion of the yield curve steepening. Investors seeking to maximize curve positioning with relative value can now go to the 13-year tenor and capture approximately 80% of the 30-year municipal curve. However, ratios in this part of the curve continue to be a challenge for many portfolios with yields in this part of the curve at only 70% of Treasuries. Flattening further out the curve has also made extending maturities less rewarding, but ratios are cheaper with investors capturing 85% of Treasuries at 30-years. Although ratios past 20-years are more attractive, relative to Treasuries, the yield curve is very flat over these longer tenors.

The new issue municipal calendar drops a bit this week with US state and local governments expected to sell around $14.2 billion of bonds. Notable deals include: Sutter Health Obligated Group, which plans to sell $1.6 billion; City of Atlanta GA Department of Aviation has scheduled $1.09 billion; State of Michigan Trunk Line Revenue is expected to offer $706.4 million; and, County of Miami-Dade Seaport Department plans to sell $656.6 million to the market. Last week, investors added approximately $1.3 billion to municipal bond mutual funds, up from $761 million the prior week, according to LSEG Lipper data. Furthermore, redemptions and maturities in the next 30-days are expected to total $25.8 billion, according to data compiled by Bloomberg. Overall, investors continue to support munis but new issue pricings remain in focus.
Herbert J. Sims & Co. Inc. is a SEC registered broker-dealer, a member of FINRA, SIPC. The information contained herein has been prepared based upon publicly available sources believed to be reliable; however, HJ Sims does not warrant its completeness or accuracy and no independent verification has been made as to its accuracy or completeness. The information contained has been prepared and is distributed solely for informational purposes and is not a solicitation or an offer to buy or sell any security or instrument or to participate in any trading or investment strategy, and is subject to change without notice. All investments include risks. Nothing in this message or report constitutes or should be construed to be accounting, tax, investment or legal advice.


HJ Sims is pleased to announce the 2026 Private Wealth Management Summit. The internal Summit will be hosted on October 12th through October 15th at The Breakers in Palm Beach, FL.
The Summit offers HJ Sims financial professionals the chance to connect, learn, and exchange insights through educational sessions, collaborative discussions, and shared experiences. Together, we aim to deepen industry expertise and strengthen our ability to serve clients at the highest level.
Let us know if you will be there! Please let us know your check-in & check-out dates if you will need a hotel room by Monday, September 7th (Marketing will coordinate hotel rooms for all attendees – attendees are responsible for booking flights and transportation).





The information contained herein is subject to change without notice. Under no circumstances shall this constitute an offer to sell or solicitation of an offer to buy. Investments involve risk including the possible loss of principal. HJ Sims is a member of FINRA and SIPC, and is not affiliated with The Breakers Palm Beach, Preferred Capital Securities, Nuveen, NexPoint, or Gladstone Capital Corporation.
Our team of market analysts have a singular mission: to help you make better investment decisions. Read the latest market commentary.
Continue readingThe bond market is showing some relief this morning on news that discussions are underway between the US and Iran following the US reportedly calling-off a major attack on the Islamic Republic. After touching $90 last week, ICE Brent Futures are now back in the low $80’s this morning. However, anxieties in the capital markets remain high following last week’s Fed meeting, which left many market participants unconvinced of the Fed’s undertaking to fight inflation. The impression of a stable labor market combined with elevated energy prices continues to feed a narrative for Fed rate hikes later this year. Fed funds futures are now pricing in the likelihood of a Fed rate hike of 25bp at over 90% by the October 27-28 meeting; which, as of early last week, was thought to occur as soon as September.
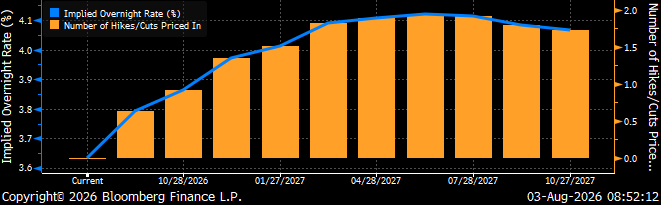
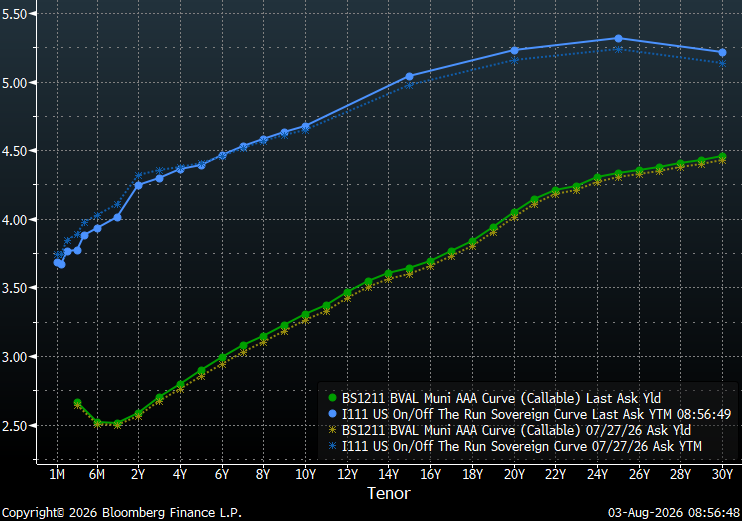
In response to last week’s Fed meeting, the Treasury curve fell for maturities shorter than five-years as markets trimmed expectations of future rate hikes while the long end saw rates rise due to long-term inflation expectations. Overall, the Treasury curve steepened while municipals demonstrated more resolve on the short-end of the curve and only sold-off slightly, by about three-basis points, on the long-end. Inflation concerns with volatile energy prices continue to hold the long-end of the Treasury curve above 5% for maturities past 15-years. The slope at the long-end of the municipal yield curve, past 20-years, remains relatively flat with a total slope of 30 bps from 21-30-years. Due to this flat tail, municipal bond investors can currently buy 20-year maturities that yield 91% of the 30-year curve versus 75% for 10-year maturities.
Over the past week, Municipal/Treasury ratios have generally declined (richened), with the largest changes occurring from on the long-end. However, over the past month we have seen a notable cheapening in ratios, particularly around the 10-year tenor. One-year ratios are now just above 60% and 10-year ratios are now over 70% of Treasuries. However, 20-year ratios remain just below 80% and 30-year ratios are well below 90% of Treasuries. For investors seeking to maximize curve positioning with relative value, the 20-year part of the municipal yield curve remains attractive with steeper slopes. Nevertheless, the shorter end of the yield curve has recently seen steeper slopes with 84 bps of slope from one to 10 years and 50 bps of slope from four to eight years. Although ratios past 20-years are more attractive, relative to Treasuries, the yield curve is very flat over these longer tenors.

The Municipal the new issue calendar ramps-up this week with US state and local governments expected to sell around $18 billion of bonds. Notable deals include: the City of New York, NY, which plans to sell $1.5 billion; Intermountain Healthcare Obligated Group has scheduled $1.11 billion; San Francisco City & County Public Utilities Commission plans to sell $814.4 million in Wastewater Revenue Bonds; and, Black Belt Energy Gas District is expected to bring $800 million to the market. Last week, investors added approximately $761 million to municipal bond mutual funds, up from $174 million the prior week, according to LSEG Lipper data. Furthermore, redemptions and maturities in the next 30-days are expected to total $32.5 billion, according to data compiled by Bloomberg. Overall, investors continue to support munis, but new issue pricings remain in focus.
Herbert J. Sims & Co. Inc. is a SEC registered broker-dealer, a member of FINRA, SIPC. The information contained herein has been prepared based upon publicly available sources believed to be reliable; however, HJ Sims does not warrant its completeness or accuracy and no independent verification has been made as to its accuracy or completeness. The information contained has been prepared and is distributed solely for informational purposes and is not a solicitation or an offer to buy or sell any security or instrument or to participate in any trading or investment strategy, and is subject to change without notice. All investments include risks. Nothing in this message or report constitutes or should be construed to be accounting, tax, investment or legal advice.
Our team of market analysts have a singular mission: to help you make better investment decisions. Read the latest market commentary.
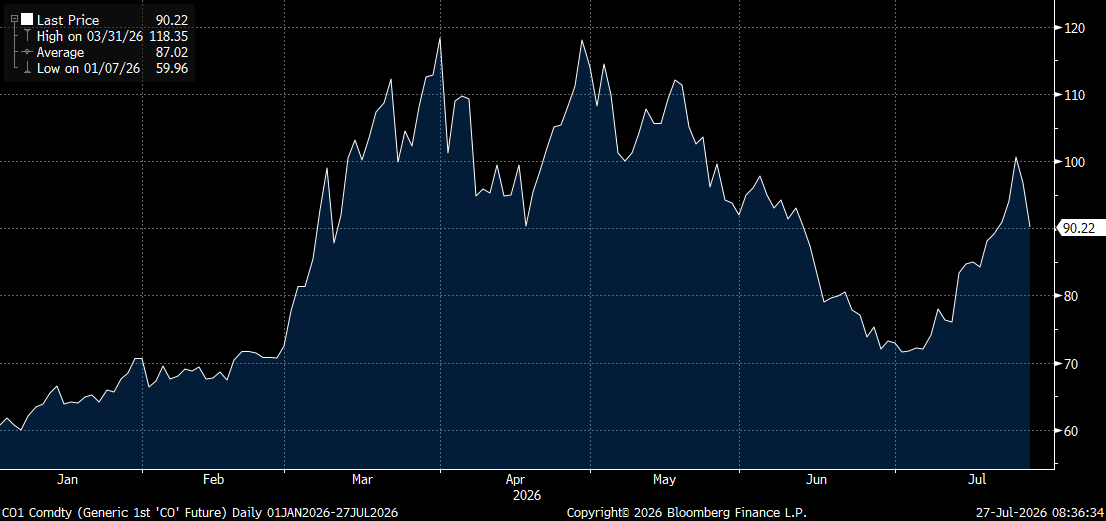
Continue readingThe bond market is showing some relief this morning following three straight nights of the US and Iran halting attacks. After touching $100 last week, ICE Brent Futures are now back to around $90 this morning. However, anxieties in the capital markets remain high as the bond market pays close attention in anticipation of this week’s Fed meeting. Last Thursday, initial jobless claims fell to 187,000, the lowest level since 1969 according to Labor Department data. The impression of a stable labor market combined with elevated oil prices is supporting the narrative for Fed rate hikes later this year. Fed funds futures are now pricing in a Fed rate hike of 25bp at the September 15-16 meeting; which, as of last week, was thought to occur as soon as October.
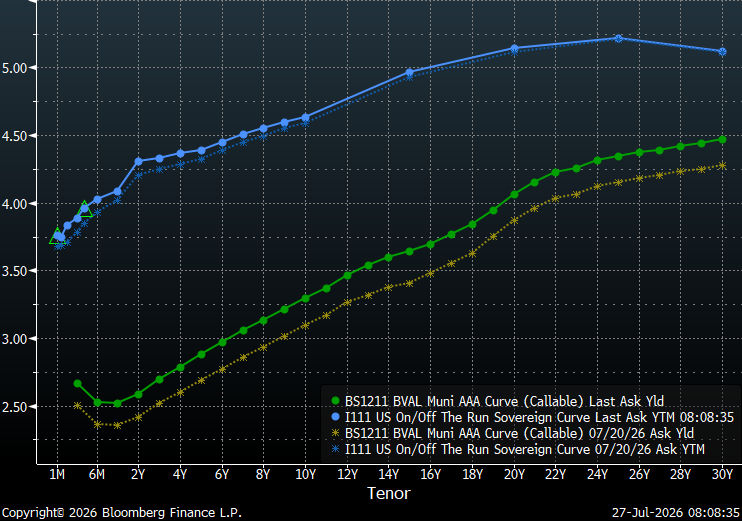
In response to last week’s aggressions, the Treasury curve jumped a bit around the policy sensitive two-year tenor while the municipal yield curve generally shifted higher. Inflation concerns with volatile energy prices continue to hold the long-end of the Treasury curve above 5% for maturities past 20-years. With tensions increasing in the Middle East last Thursday and rising oil prices, the municipal yield curve experienced some of the largest cuts in months with yields increasing roughly 12 bps per year from 2027 to 2056. Overall, the municipal curve is now about a 20 bps higher this week following a parallel shift upward with the largest moves around the 15-year tenor and the smallest moves around the 1-year tenor, as investor position defensively. The slope at the long-end of the municipal yield curve, past 20-years, remains relatively flat with a total slope of 30 bps from 21-30-years. Due to this flat tail, municipal bond investors can currently buy 20-year maturities that yield 91% of the 30-year curve versus 74% for 10-year maturities.
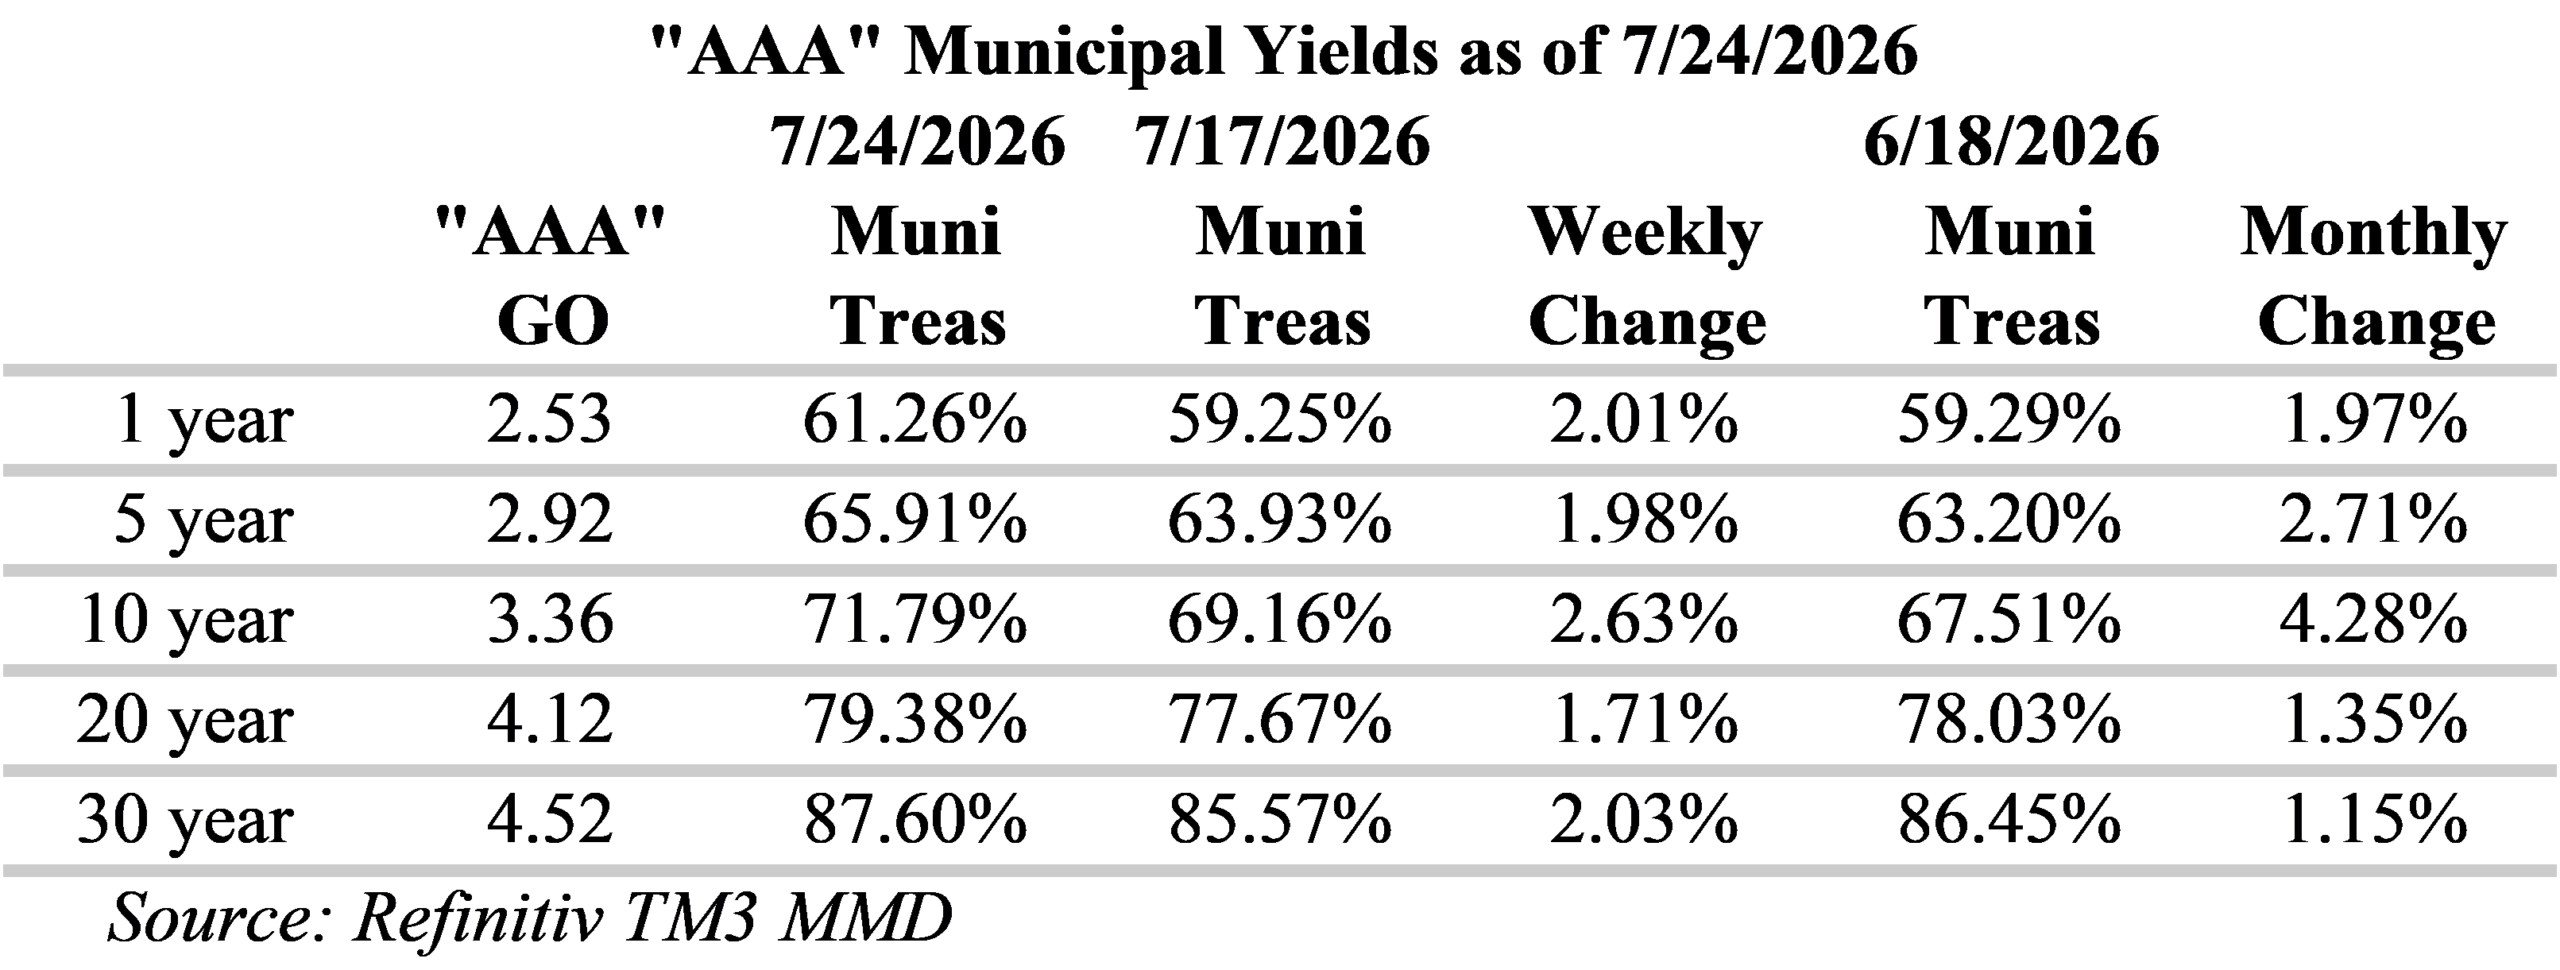
Over the past week, Municipal/Treasury ratios have generally increased (cheapened), with the largest changes occurring from one to 10 years. One-year ratios are now just above 60% and 10-year ratios now over 70% of Treasuries. However, 20-year ratios remain just below 80% and 30-year ratios are well below 90% of Treasuries. For investors seeking to maximize curve positioning with relative value, the 20-year part of the municipal yield curve is attractive with steeper slopes and yields at approximately 80% of Treasuries. However, the shorter end of the yield curve has recently seen slopes steepening with 83 bps of slope from one to 10 years and 50 bps of slope from four to eight years. Although ratios past 20-years are more attractive, relative to Treasuries, the yield curve is very flat over these longer tenors.
The Municipal new issue calendar remains elevated this week with US state and local governments expected to sell around $12.4 billion of bonds. Notable deals include: the Henry Ford Health System Obligated Group, which plans to sell $1.3 billion; Advent Health Obligated Group has scheduled $1.03 billion; Long Island Power Authority is expected to offer $946.1 million; and, County of Harris, Texas has a $665 million deal on the calendar. Last week, municipal bond mutual fund inflows declined significantly from $1.36 billion of inflows the prior week to $174 million last week, according to LSEG Lipper data. Overall, investors continue to support munis but new issue pricings remain in focus.
Herbert J. Sims & Co. Inc. is a SEC registered broker-dealer, a member of FINRA, SIPC. The information contained herein has been prepared based upon publicly available sources believed to be reliable; however, HJ Sims does not warrant its completeness or accuracy and no independent verification has been made as to its accuracy or completeness. The information contained has been prepared and is distributed solely for informational purposes and is not a solicitation or an offer to buy or sell any security or instrument or to participate in any trading or investment strategy, and is subject to change without notice. All investments include risks. Nothing in this message or report constitutes or should be construed to be accounting, tax, investment or legal advice.