

Our team of market analysts have a singular mission: to help you make better investment decisions. Read the latest market commentary.
Continue readingOur team of market analysts have a singular mission: to help you make better investment decisions. Read the latest market commentary.
Continue readingOur team of market analysts have a singular mission: to help you make better investment decisions. Read the latest market commentary.
Continue readingLast week we experienced the second government shutdown in just four months. Following the approval of a spending package by Congress last Tuesday afternoon, funding for the majority of federal agencies was secured through September. However, the package only funded Homeland Security through 2/13 (this Friday). Keep in mind that Homeland Security isn’t just ICE, it also includes: TSA, FEMA, the Coast Guard and the Secret Service. Should Homeland Security fail to receive funding, there is the potential for economic consequences and travel interruptions.
As a result of the shutdown, the Department of Labor was not able to issue its report on U.S. hiring in January, as scheduled last Friday. The Bureau of Labor Statistics has rescheduled the release of The Employment Situation for this Wednesday, February 11 and CPI is scheduled to be released on Friday. Unfortunately, the disruption in jobs data comes amid uncertainty regarding the strength of the labor market amid speculation about the timing of future interest rate cuts by the Fed. Currently, the fed-funds futures market is anticipating a 25bps cut later this year in June.
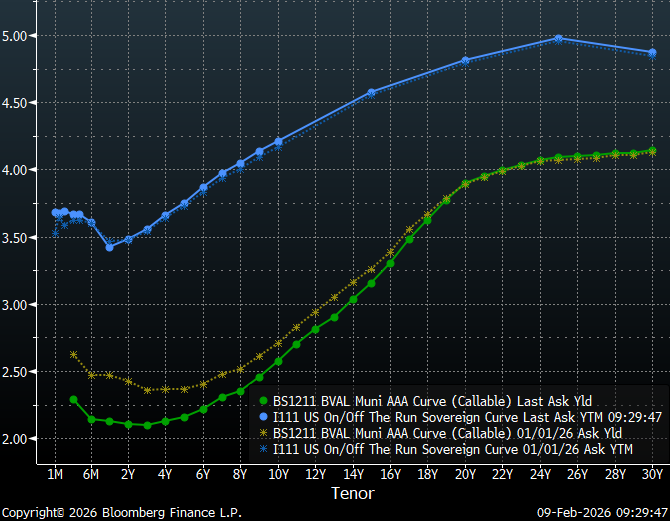
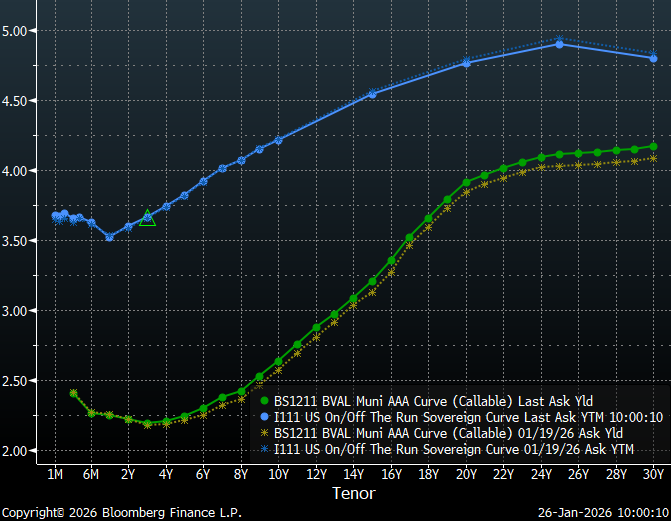
Over the past month, municipal bond yields have generally shifted lower, resulting in an overall steeper curve and shorter maturities outperforming longer maturities. The front-end of the curve has shifted lower roughly 33 bps for tenors shorter than 2-years due to strong demand from separately managed accounts and retail investors. However, Treasuries for maturities longer than 6- months have not moved meaningfully over the past month.
Slopes along the municipal yield curve have become consistently steep from 10 to 20-years, with 137 bps of slope compared to 49 bps from 1 to 10-years and 32 bps from 20 to 30-years. By positioning in the longer intermediate portion of the curve, investors benefit from a steep roll-down over time. Furthermore, due to flat long-term rates, municipal bond investors can currently buy maturities under 20-years that yield approximately 90% of the 30-year curve. With muni/Treasury ratios for 10-year and shorter maturities quite rich at around 60%, extending maturities further out the curve has the added benefit of more appealing relative yields. Ratios in 20-year and longer maturities remain attractive, relative to Treasuries, due to weaker demand and wider spreads. However, the yield curve remains very flat over these longer tenors. For investors seeking to maximize curve positioning with relative value, the 17 to 20-year part of the municipal yield curve has become very tempting with slopes of approximately 15-bps per year.
The municipal new issue calendar expands again this week with $13.6 billion of new issues scheduled to price. Notable issues include: the State of Washington with $1.3 billion of bonds, Houston Methodist Hospital Obligated Group has scheduled $1.26 billion, District of Columbia has a $929.6 million issue and Portland Public Schools, OR, is planning to sell $660 million. This week’s deals should see a strong reception following the second week of inflows over $2 billion with municipal bond funds receiving $2.4 billion last week, according to LSEG Lipper Global Fund Flows. Considering current muni/Treasury ratios, it is not surprising the majority of inflows are going to long-term muni funds, which reportedly received $1.8 billion.
Herbert J. Sims & Co. Inc. is a SEC registered broker-dealer, a member of FINRA, SIPC. The information contained herein has been prepared based upon publicly available sources believed to be reliable; however, HJ Sims does not warrant its completeness or accuracy and no independent verification has been made as to its accuracy or completeness. The information contained has been prepared and is distributed solely for informational purposes and is not a solicitation or an offer to buy or sell any security or instrument or to participate in any trading or investment strategy, and is subject to change without notice. All investments include risks. Nothing in this message or report constitutes or should be construed to be accounting, tax, investment or legal advice.
Our team of market analysts have a singular mission: to help you make better investment decisions. Read the latest market commentary.
Continue readingAlthough the Federal Reserve’s rate decision was the primary economic event last week, the President’s announcement of his Fed chair nominee was arguably more impactful. Markets had a mixed response to the selection of Kevin Warsh as the next Fed chair. While his qualifications, particularly his experience as Fed governor from 2006 to 2011, were welcome news; there remains significant uncertainty about how he will balance the attentions of the Federal Reserve. Fed policymakers have recently been divided on whether to prioritize labor market concerns or stubbornly high inflation that remains above target levels.
In addition, the partial shutdown of the government took effect on Saturday, as lawmakers struggle to find common ground on the funding of immigration agencies. However, since Congress already passed half of this year’s funding bills last year, several federal agencies and programs continue to operate through September. Nevertheless, the government shutdown still affects the departments of Defense, Homeland Security, Labor, Health and Human Services, Education, Treasury and Housing and Urban Development, in addition to agencies like the Securities and Exchange Commission. Also, should the shutdown persists through the week, Friday’s Labor Department’s jobs report could potentially be delayed.
Over the past week, municipal bond yields have shifted slightly lower. The front-end of the curve has dropped roughly two bps out to about 10-years, approximately three bps from 10 to 15 years and less than one bps out to 30-years. However, Treasuries sold off seven to eight bps on the long-end as the Treasury curve steepened amid Fed leadership uncertainty. Furthermore, both curves have steepened over the past month with yields falling on the short-end and rising slightly on the long-end as investors focus on shorter maturities amid uncertainty.
Recently, slopes along the municipal yield curve have become consistently steep from 10 to 20-years, with 134 bps of overall slope compared to 45 bps from 1 to 10-years and 32 bps from 20 to 30-years. By positioning in the longer intermediate portion of the curve, investors benefit from a steep roll-down over time. Furthermore, due to flat long-term rates, municipal bond investors can currently buy maturities under 20-years that yield approximately 90% of the 30-year curve. With muni/Treasury ratios for 10-year and shorter maturities quite rich at around 60%, extending maturities further out the curve has the added benefit of more appealing relative yields. Ratios from 20-years and longer remain attractive relative to Treasuries due to weaker demand and wider spreads. However, the yield curve remains very flat over these longer tenors. For investors seeking to maximize curve positioning with relative value, the 19-year part of the municipal yield curve has become very tempting with a combination of appealing relative yields and a steep slope that rewards extension.
U.S. State and local governments sold $34.9 billion of munis in January versus $36.7 billion a year ago, a decline of 5.1%, according to data compiled by Bloomberg League Tables. However, with over $8.29 billion in new deals on the calendar, issuance is expected to accelerate this week. Significant deals include: RiverSpring Health Senior Living Inc Obligated Group, which plans to sell $634.2 million of bonds, co-managed by HJ Sims; Washington Suburban Sanitary Commission, scheduled to sell $366.6 million; and, San Diego County Regional Transportation Commission, which plans to offer $343.3 million. In addition, investors will likely be receptive after adding $2.062 billion to municipal bond mutual funds last week following $993.6 million the prior week, according to LSEG Lipper data.
Herbert J. Sims & Co. Inc. is a SEC registered broker-dealer, a member of FINRA, SIPC. The information contained herein has been prepared based upon publicly available sources believed to be reliable; however, HJ Sims does not warrant its completeness or accuracy and no independent verification has been made as to its accuracy or completeness. The information contained has been prepared and is distributed solely for informational purposes and is not a solicitation or an offer to buy or sell any security or instrument or to participate in any trading or investment strategy, and is subject to change without notice. All investments include risks. Nothing in this message or report constitutes or should be construed to be accounting, tax, investment or legal advice.
Our team of market analysts have a singular mission: to help you make better investment decisions. Read the latest market commentary.
Continue readingThis morning on the trade desk, accounts are distracted by Winter Storm Fern, which has created havoc from Texas to Maine with 24 states declaring emergencies. In addition to widespread power outages, many roads and highways remain impassable and flight cancellations have reached levels not seen since the early days of the Pandemic. Despite the inclement weather, Treasuries rose over the five to 30-year tenors resulting in yields dropping to their lowest levels since last week’s volatility. Following a preliminary announcement by the Commerce Department of stronger than anticipated durable goods orders for November, gains were briefly pared.
Early last week, international events came into focus following instability in the Japanese bond market. Yields surged in the Japanese bond market following a pitch by Japanese Prime Minister Sanae Takaichi to cut taxes on food, which markets interpreted to mean increased government bond issuance. The result was 40-year Japanese yields jumping to the highest level of any maturity of the nation’s sovereign debt in more than three decades. In addition, escalating tensions over the control of Greenland with the threat of tariffs on European goods added to the melee. The municipal bond market responded to the uncertainty with bonds selling-off. As of the end of the day on Tuesday, MMD ultimately cut yields from 2bps in 2027-28 to 7 bps in 2041-56.
Despite the volatility early in the week, rates were relatively unchanged over the week. Treasuries outperformed munis with 30-year Treasury bonds rallying 3.3 bps while 30-year munis sold-off 8.7 bps. The overall result was a flatter Treasury curve and a steeper muni curve. Slopes along the municipal yield curve are steepest from 11 to 12 years, with 27 bps of slope and from 14 to 20-years, with 95 bps of slope. In addition, investors benefit from a steep roll-down over time. Although the municipal yield curve is currently rewarding duration, investors should be cautious when extending to maturities past 20-years, where the long-end becomes very flat. As a result of this flat tail, municipal bond investors can buy maturities under 20-years that yield over 90% of the 30-year curve.
Muni/Treasury ratios for 10-year and shorter maturities have seen significant declines over the past month due to a concentration of retail demand at the front end of the yield curve. However, this is a still an improvement from September, when ratios in the 1-year tenor dropped to as low as 56%. Ratios further out the curve, from 20-years and longer, remain attractive relative to Treasuries due to weaker demand and wider spreads. For investors seeking to maximize curve positioning with relative value, extending to the 19-year part of the municipal yield curve provides over 90% of the 30-year maturity and over 80% of equivalent Treasury yields. In the rich belly of the curve, particularly around 5-years, we are hearing reluctance from institutional investors citing these ratios as unappealing relative to the rest of the curve.
Municipal new issuance volume is expected to be relatively quiet this week, with a just over $4 billion on the calendar. Significant deals include $750 million from the Triborough Bridge & Tunnel Authority and Florida Health Sciences Center Inc. Obligated Group with $369.3 million. Furthermore, states and local governments are planning to issue just under $9 billion in new supply over the next 30 days, according to data compiled by Bloomberg. In addition, the FOMC is scheduled to hold its press conference later this week to brief the markets. Currently, markets expect the Fed to hold rates steady following three straight cuts last year. In addition, the markets will be looking to the Fed for signals about where rates are headed.
Herbert J. Sims & Co. Inc. is a SEC registered broker-dealer, a member of FINRA, SIPC. The information contained herein has been prepared based upon publicly available sources believed to be reliable; however, HJ Sims does not warrant its completeness or accuracy and no independent verification has been made as to its accuracy or completeness. The information contained has been prepared and is distributed solely for informational purposes and is not a solicitation or an offer to buy or sell any security or instrument or to participate in any trading or investment strategy, and is subject to change without notice. All investments include risks. Nothing in this message or report constitutes or should be construed to be accounting, tax, investment or legal advice.
Our team of market analysts have a singular mission: to help you make better investment decisions. Read the latest market commentary.
Continue readingOur team of market analysts have a singular mission: to help you make better investment decisions. Read the latest market commentary.
Continue readingLast week, the Bureau of Labor Statistics reported a drop in the unemployment rate to 4.4% in December, down from 4.5% in November. However, nonfarm payroll employment levels crept up by 50,000 workers, which was less than the downwardly revised 56,000 in November and short of analyst estimates. Overall, it was a mixed report that supports the narrative of a low hire, low fire job market and is unlikely to inspire a rate cut at the FOMC meeting later this month. Although December’s employment data did little to provide the clarity the capital markets are seeking, it was also not sufficiently weak to warrant a rate cut. Currently, fed funds futures are pricing-in only a 5% change of the Fed cutting rates in January.
The markets responded to this news with Treasuries selling-off, largely around the policy sensitive 2-year tenor with Treasury yields largely unchanged past about 10-years. Conversely, ‘AAA’ municipal yields fell across the curve, with the largest declines concentrated in the first few years. The rally in munis was largely supply driven following a modest calendar at year-end and a bit of a slow start to the new year. However, weekend news of the US central bank being subpoenaed by the Justice Department with threats of criminal indictment have markets concerned about Fed independence. In addition, this week is a heavy week for economic data with December’s Consumer Price Index scheduled to be released on Tuesday and November’s Producer Price Index scheduled to be released on Wednesday. As markets digest these events there is heightened level of risk for rate volatility over the next few days. In addition, as shown below, ACM 10-year Treasury term premium are at about the highest levels seen in over a decade. This is an indication of some nervousness about future and provides bond investors with a reward for assuming duration.

Slopes along the municipal yield curve are steepest from 14 to 19-years, with over 80 bps of slope. Like the Treasury curve, the municipal yield curve also rewards investors for extending duration. Investors benefit from a steep roll-down over time as bonds mature. Although the municipal yield curve is currently rewarding duration, investors should be cautious when extending to maturities past 20-years, where the long-end becomes very flat. As a result of this flat tail, municipal bond investors can buy maturities under 20-years that yield over 90% of the 30-year curve.
Muni/Treasury ratios for 5-year and shorter maturities have seen significant declines over the past month due to a concentration of retail demand remains at the front end of the yield curve. However, this is a still an improvement from September, when ratios in the 1-year tenor dropped to as low as 56%. Ratios further out the curve, 20-years and longer, remain attractive due to weaker demand and wider spreads. For investors seeking to maximize curve positioning with relative value, extending to the 19-year part of the municipal yield curve provides over 90% of the 30-year maturity and over 80% of equivalent Treasury yields. In contrast to the rich belly of the curve, particularly from 5 to 10-years, we should start to see more pressure on the long-end as investors are tempted to extend duration by higher yields and relative value.

Municipal new issuance volume is expected to pick-up this week with over $11 billion in new issues on the calendar, up from approximately $7 billion last week. The New York City Transitional Finance Authority Future Tax Secured Revenue plans to sell $1.5 billion of bonds, Metropolitan Nashville Airport Authority is on the calendar with $1.28 billion, and California Community Choice Financing Authority is scheduled to offer $850 million. This past week, municipal bond mutual funds and ETF’s collectively benefitted from a little over $2 billion of inflows. Furthermore, last week was the fifth straight week that net flows topped $1 billion for municipal ETF’s. Given the strong fund flows and current relative values, this week’s larger calendar should face a receptive audience.
Herbert J. Sims & Co. Inc. is a SEC registered broker-dealer, a member of FINRA, SIPC. The information contained herein has been prepared based upon publicly available sources believed to be reliable; however, HJ Sims does not warrant its completeness or accuracy and no independent verification has been made as to its accuracy or completeness. The information contained has been prepared and is distributed solely for informational purposes and is not a solicitation or an offer to buy or sell any security or instrument or to participate in any trading or investment strategy, and is subject to change without notice. All investments include risks. Nothing in this message or report constitutes or should be construed to be accounting, tax, investment or legal advice.
Our team of market analysts have a singular mission: to help you make better investment decisions. Read the latest market commentary.
Continue readingAlthough last week was a noteworthy week in terms of economic releases, yields for maturities past 6-months are largely unchanged. Last week’s economic releases included nonfarm payroll employment and the unemployment rate on Tuesday and the Consumer price Index on Thursday, hitting on both of the Fed’s primary goals of maximum employment and stable prices. Both the unemployment rate, at 4.6%, and the number of unemployed, at 7.8 million, were little changed from September. However, the current unemployment reading has crept up to the highest level seen in over 4-years. In addition, the all items CPI index, released on Thursday, surprised with a decrease in year-over-year inflation to 2.7%. The drop in inflation was largely attributed to a decline in the rent index and the owners’ equivalent rent index. It is important to note that we will have another payroll release prior to the Fed’s January meeting.

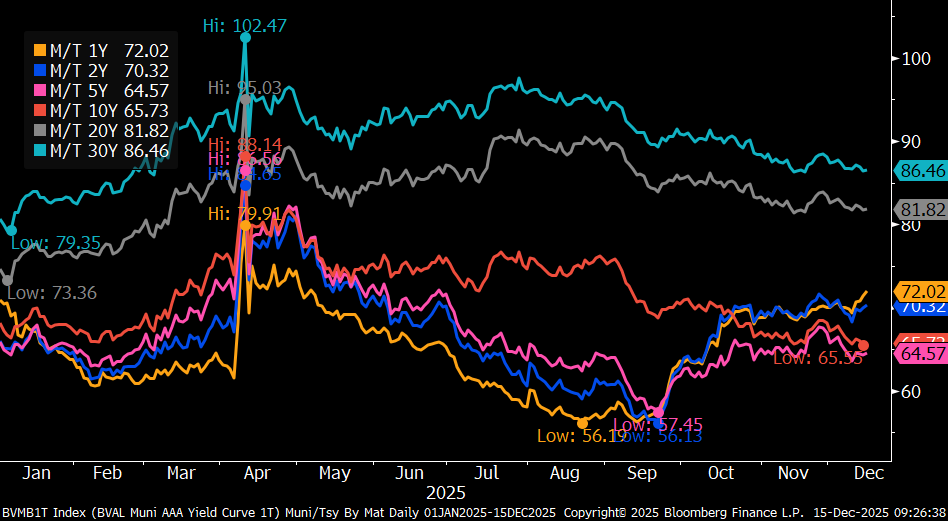
Given the mixed economic news, it is not surprising that the fixed income markets were largely unchanged over this past week. The prospect of additional rate cuts next year supports lower short-term yields, while long-maturity tenors are seeing the influence of elevated inflation expectations. But it is not just the past week that yields have held steady, even looking back two months to late October yields have been surprisingly steady. In the graph above, Treasury yields show the greatest change with modest steepening while municipals experienced relatively little change, particularly in the 5 to 20-year tenors.
Slopes along the municipal yield curve are currently steepest around the 16-year tenor, with over 100 bps in slope from 10 to 19-years. This slope of the municipal yield curve currently rewards investors for extending from the 10-year range to the 15-20-year range. In addition, investors benefit from a steep roll-down over time. Although the municipal yield curve is currently rewarding duration, investors should be cautious when extending to maturities past 20-years, where the long-end becomes very flat. As a result of this flat tail, municipal bond investors can buy maturities under 20-years that yield over 90% of the 30-year curve.
Muni/Treasury ratios have generally cheapened/increased over the past week, except around the 1-year maturity, where ratios actually decreased to just above 70%. However, this is a remarkable change from September, when ratios in the 1-year tenor dropped to as low as 56%. When combined with modest inversion over the first 5-years of the curve and more appealing ratios at the short-end, investors hiding-out in cash or spooked by inflation may be tempted by short municipals. Nevertheless, for investors seeking to maximize curve positioning with relative value, extending to the 19-year part of the municipal yield curve provides 90% of the 30-year maturity and 80% of equivalent Treasury yields.

Over the next two weeks, the new issue calendar is relatively quiet for municipals. Tomorrow, the Bureau of Economic Analysis is scheduled to release its initial estimate of GDP for the third quarter. The original report was delayed due to the government shutdown. The Bureau of Labor Services is also scheduled to release updated July, August and September PCE Inflation (the Fed’s preferred gauge) data tomorrow. Following the Fed lowering rates by a quarter point on Dec. 10 and the divided opinions within the Fed, the fed funds futures are currently pricing-in only a 20% change of the Fed cutting rates in January.
Herbert J. Sims & Co. Inc. is a SEC registered broker-dealer, a member of FINRA, SIPC. The information contained herein has been prepared based upon publicly available sources believed to be reliable; however, HJ Sims does not warrant its completeness or accuracy and no independent verification has been made as to its accuracy or completeness. The information contained has been prepared and is distributed solely for informational purposes and is not a solicitation or an offer to buy or sell any security or instrument or to participate in any trading or investment strategy, and is subject to change without notice. All investments include risks. Nothing in this message or report constitutes or should be construed to be accounting, tax, investment or legal advice.
Our team of market analysts have a singular mission: to help you make better investment decisions. Read the latest market commentary.
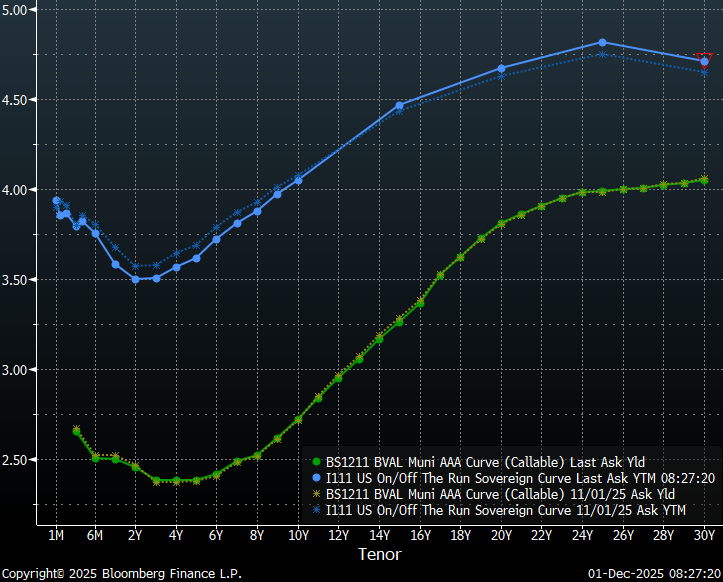
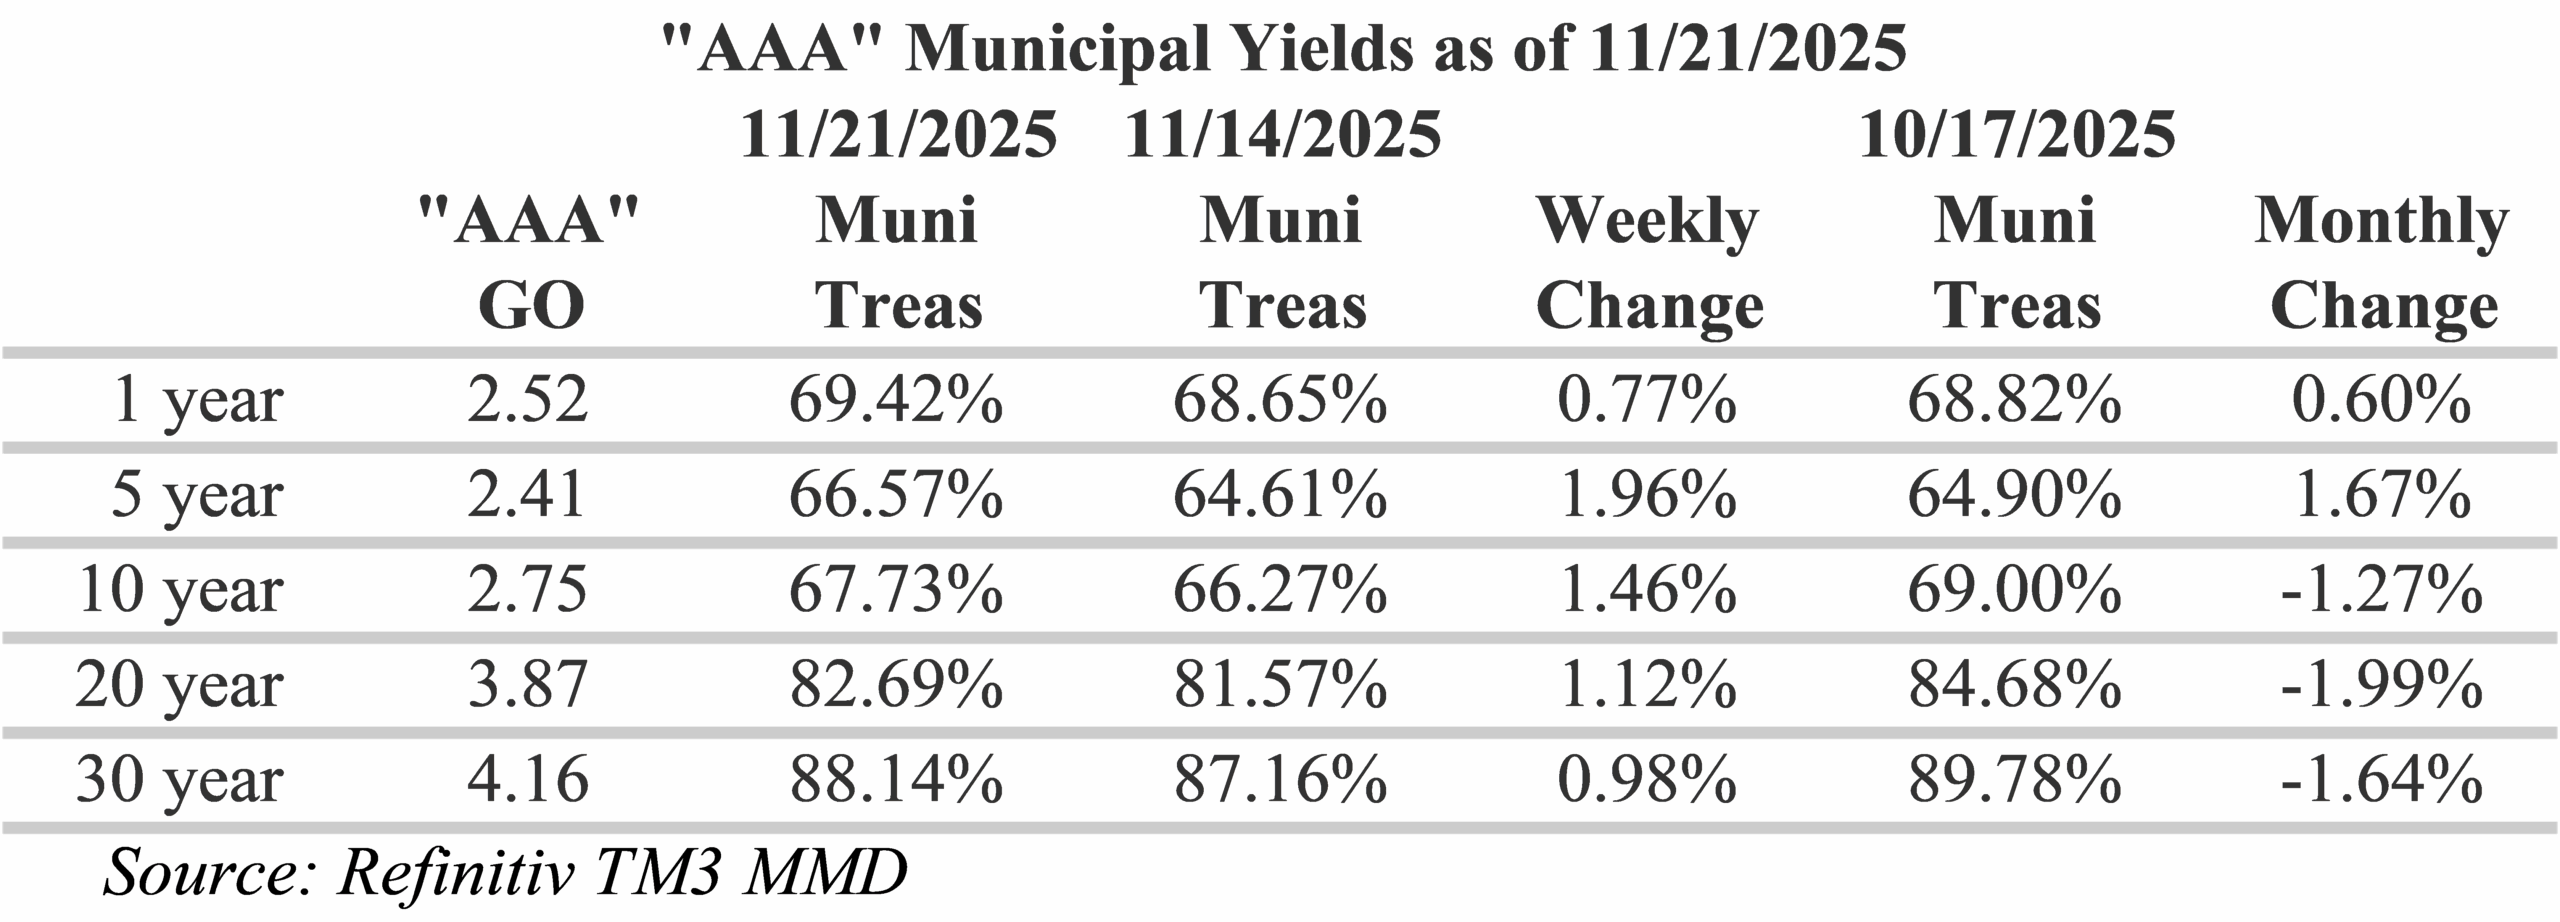
Continue readingLast week, the Fed held its final meeting of 2025, with officials voting to cut its policy interest rate by a quarter-point for a third consecutive meeting. A lack of economic data, stemming from the longest-ever government closure, combined with a weakening labor market and lingering inflation has led to policy uncertainty. As a result, the Fed’s decision was not unanimous, with two regional Fed bank presidents voting to hold rates steady with one Fed governor voting for a half-point cut and nine members voting for a quarter-point cut. The market’s response to the decision has been relatively muted, with Treasuries rallying six to nine-basis points on the short-end of the curve and selling-off around four basis points on the long-end while munis were largely unchanged out to around 10-years and selling-off around two basis points on the long-end.
The markets continue to be responsive to comments from the Fed. The prospect of additional rate cuts next year supports lower short-term Treasury yields, while long-maturity tenors are supported by elevated inflation expectations. However, on the long-end, rate cuts into a relatively strong economy have the potential to ignite inflation to the detriment of long-duration assets. As shown in the graph below, slopes for municipals from both two to ten-years and from ten to twenty-years have steepened significantly in recent months relative to Treasuries.
Slopes along the municipal yield curve are currently steepest around the 16-year tenor, with over 100 bps in slope from 10 to 19-years. As a result, the municipal yield curve currently rewards investors for extending from the 10-year range to the 15-20-year range. Investors also benefit from a steep roll-down over time. Although the municipal yield curve is currently rewarding duration, investors should be cautious when extending to maturities past 20-years, where the long-end becomes very flat. As a result of this flat tail, municipal bond investors can buy maturities under 20-years that yield over 90% of the 30-year curve.
Muni/Treasury ratios generally dropped over the past week. However, the biggest moves were around the 1-year maturity where ratios actually increased to just above 70%. This move was not a surprise since the extreme short-end of the curve is where the Fed exerts its greatest influence. However, this is a remarkable change from September, when ratios in this tenor dropped to as low as 56%. Nevertheless, for investors seeking to maximize curve positioning with relative value, extending to the 19-year part of the municipal yield curve provides 90% of the 30-year municipal maturity and 80% of equivalent Treasury yields.
This week, there is a busy economic calendar with the November jobs report along with an estimate of October payrolls due on Tuesday and the consumer price index scheduled for release on Thursday. Although bond traders are betting the Fed cuts rates twice next year, the Fed’s “dot plot” is currently indicating just one reduction in 2026. Therefore, we could see some volatility this week in response to the new data due to the mis-match of expectations. The markets are likely to embrace softer labor data as an indication of a more-dovish Fed. In addition, there is a seasonal push for borrowers to complete transactions before year-end. This week, the municipal bond market is expected to offer more than $6 billion in new issues. Notable deals this week include: New York Transitional Finance Authority with $2 billion and Ohio State University with $562 million.
Herbert J. Sims & Co. Inc. is a SEC registered broker-dealer, a member of FINRA, SIPC. The information contained herein has been prepared based upon publicly available sources believed to be reliable; however, HJ Sims does not warrant its completeness or accuracy and no independent verification has been made as to its accuracy or completeness. The information contained has been prepared and is distributed solely for informational purposes and is not a solicitation or an offer to buy or sell any security or instrument or to participate in any trading or investment strategy, and is subject to change without notice. All investments include risks. Nothing in this message or report constitutes or should be construed to be accounting, tax, investment or legal advice.
Our team of market analysts have a singular mission: to help you make better investment decisions. Read the latest market commentary.
Continue readingThis past week, the Treasury curve shifted up eight to nine basis points in a parallel fashion from two years out while municipal yields remain essentially unchanged with the long end only about a basis point higher. The result is a steeper Treasury curve with municipal bonds generally outperforming Treasuries. Perhaps the most meaningful developments occurred in Treasuries on the extreme short-end with one-month and two-month yields rallying 10 to 20 basis points in anticipation of a Fed rate cut this week. However, following last Friday’s release of the delayed core personal consumption expenditures price index form the Bureau of Economic Analysis, inflation concerns were reinforced with prices up 0.2% from August and 2.8% from the prior year. As a result, the rate cut expected at the Fed’s final 2025 meeting later this week could potentially accelerate inflation concerns on the long-end.
Moreover, the balance of the year has the potential to be more dynamic than previous years for the fixed income markets. As a result of the shutdown, the traditional data-release schedules have been pushed-back this year. November payroll data will not be published until next Tuesday on December 16, November’s CPI is scheduled for release two days later on December 18 and third quarter GDP is scheduled to be released just two days before Christmas. In addition, the Supreme Court could release their decision on the IEEPA tariff case later this month.
Slopes along the municipal yield curve continue to be steepest around the 16-year tenor, with over 100 bps in slope from 10 to 19-years. This is a significant change from earlier last month, when the steepest slopes were around the 10-year tenor. This shift has increased the reward to investors for extending from the 10-year range to the 15-20-year range. In addition, investors benefit from a steep roll-down over time. Although the municipal yield curve is currently rewarding duration, investors should be cautious when extending to maturities past 20-years, where the long-end becomes very flat. As a result of this flat tail, municipal bond investors can buy maturities under 20-years that yield over 90% of the 30-year curve.
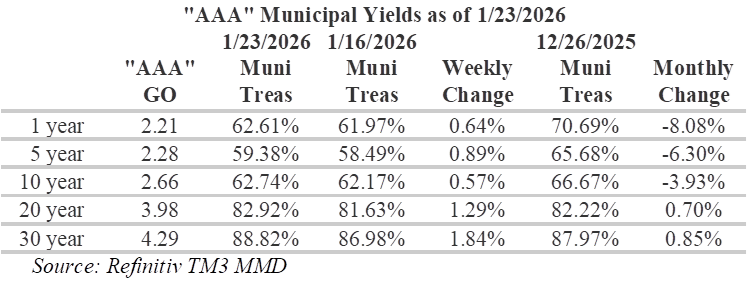
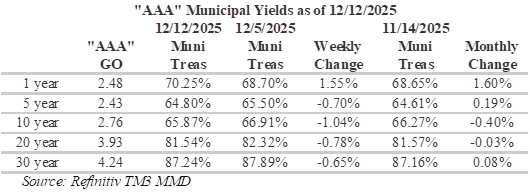
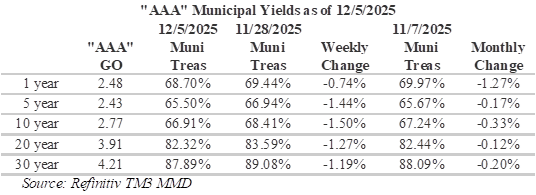
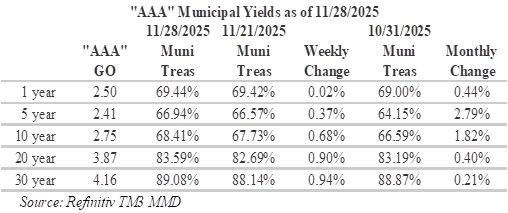
Elevated municipal tax-equivalent yields on the long-end continue to reward investors, although not by as much as they did last week. Muni/Treasury ratios have generally dropped a bit over the past week, with the biggest moves around the 10-year maturity where ratios have declined 1.5% to 66.91%. Ratios of this level are historically rich and primarily appeal to individuals investors in the top tax brackets. Not surprisingly, over the past month, the biggest moves have been on the extreme short-end of the curve where the Fed exerts its greatest influence. One-year ratios are now 1.27% richer as ratios have dropped to 68.70%. For investors seeking to maximize curve positioning with relative value, extending to the 18-year part of the municipal yield curve provides 88% of the 30-year maturity and 77.5% of equivalent Treasury yields.
This week, the municipal bond market is expected to offer more than $10 billion in new issues following a $15 billion calendar last week. Notable deals this week include: $2 billion Regents of the University of California Revenue Bonds, $1 billion Chicago O’Hare International Airport and New York Housing Development Corp. with $753 million. Fund flows have generally been supportive over the past month. LSEG Lipper Global Fund Flows reported that intermediate-maturity municipal bond funds saw inflows of $133 million last week while high-yield municipal bond funds experienced inflows of about $253 million and long-term muni funds saw inflows of about $320 million.
Herbert J. Sims & Co. Inc. is a SEC registered broker-dealer, a member of FINRA, SIPC. The information contained herein has been prepared based upon publicly available sources believed to be reliable; however, HJ Sims does not warrant its completeness or accuracy and no independent verification has been made as to its accuracy or completeness. The information contained has been prepared and is distributed solely for informational purposes and is not a solicitation or an offer to buy or sell any security or instrument or to participate in any trading or investment strategy, and is subject to change without notice. All investments include risks. Nothing in this message or report constitutes or should be construed to be accounting, tax, investment or legal advice.
Our team of market analysts have a singular mission: to help you make better investment decisions. Read the latest market commentary.
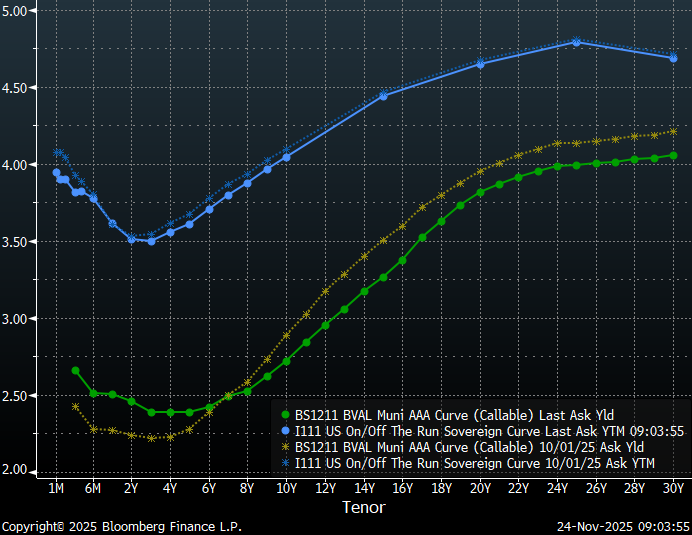
Continue readingDespite uncertainty regarding the reopening of the U.S. government, conflicting information from Fed policymakers and the wild swings in market sentiment regarding the prospects of another rate cut, yields on municipal bonds and Treasuries have changed relatively little over the past month. Municipal yields for all tenors were generally within a basis point or less of their yields from the beginning of November and Treasuries were also relatively unchanged with a slight steepening as rates rallied modestly from 6-weeks to 5-years and sold off 7 to 10-basis points in tenors past 15-years. The stability in the fixed income markets can partially be attributed to the lack of key economic data during the shutdown and the continuation of long-term trends with structural labor market concerns and continued stubbornly high inflation.
This morning the Fed funds futures market was pricing-in the probability of a third rate cut this year at over 100%, which is a dramatic shift from just a few weeks ago when the probability was in the high 20% range. Although recent economic data has been largely supportive of a rate cut, should the Fed maintain current rates we will likely see some turbulence given implied rates. Lately business activity has been slowing. Today’s ISM Manufacturing Index contracted for the 9th straight month with activity shrinking by the most in four months. However, the employment picture is still not clear. The BLS will not be publishing the October employment report until after the Fed issues its decision, which is also when it will be releasing November data.
Slopes along the municipal yield curve are currently steepest around the 16-year tenor, with over 100 bps in slope from 10 to 19-years. This is a significant change from earlier last month, when the steepest slopes were around the 10-year tenor. This shift has increased the reward to investors for extending from the 10-year range to the 15-20-year range. In addition, investors benefit from a steep roll-down over time. Although the municipal yield curve is currently rewarding duration, the long-end has become very flat with steadily declining slopes from 20 to 30-years and only a basis point or so per year past 25-years. As a result of this flat tail, municipal bond investors can buy maturities under 20-years that yield over 90% of the 30-year curve.
Elevated municipal tax-equivalent yields on the long-end continue to reward investors, with ratios generally cheapening over the past week. The muni/Treasury ratio is a widely watched measure that provides a sense of how tax-exempt munis fare against taxable fixed-income options. Crossover investors, which seek to identify the best opportunities in the fixed income universe on an after-tax basis, closely follow this ratio. Over the past week, the biggest moves have been on the long-end of the curve, where ratios are approaching 90%. Over the past month, the biggest moves have been around the 5-year maturity where ratios are approaching 3% richer. For investors seeking to maximize curve positioning with relative value, extending to the 18-year part of the municipal yield curve provides almost 90% of the 30-year maturity and almost 80% of equivalent Treasury yields.
This week, the municipal bond market is expected to price more than $14.6 billion in new issues. Notable deals this week include: State of Connecticut Special Tax Revenue Bonds with $1.56 billion, Long Island Lighting Company with $1.02 billion and City of San Antonio TX Electric & Gas Systems Revenue with $599.8 million. Fund flows have also generally been supportive over the past month. ICI data reported that exchange-traded funds saw inflows of $366 million during the holiday week Last week following a staggering $2.735 billion of inflows the week prior.
Herbert J. Sims & Co. Inc. is a SEC registered broker-dealer, a member of FINRA, SIPC. The information contained herein has been prepared based upon publicly available sources believed to be reliable; however, HJ Sims does not warrant its completeness or accuracy and no independent verification has been made as to its accuracy or completeness. The information contained has been prepared and is distributed solely for informational purposes and is not a solicitation or an offer to buy or sell any security or instrument or to participate in any trading or investment strategy, and is subject to change without notice. All investments include risks. Nothing in this message or report constitutes or should be construed to be accounting, tax, investment or legal advice.
Economic data releases resumed last Thursday with the U.S. Department of Labor’s (BLS) release of the long-delayed September employment report. The BLS report did not deliver the clarity that markets are seeking regarding the central bank’s likely path. Although nonfarm payroll employment came in stronger than expected with 119,000 jobs added in September, the report also showed the jobless rate edging-up to the highest level in nearly four years to 4.4%. The increase in the jobless rate is not all that surprising, given the widely reported agency-by-agency filings showing the administration attempted to terminate a total of 3,605 employees during the shutdown. Employment gains were driven by health care, food services and drinking places, and social assistance. To add to the market’s uncertainty, the BLS will not be publishing the October employment report until after the Fed issues its decision on December 10 which is also when it will be releasing November data.
Rate expectations have varied widely in recent weeks due to conflicting information from Fed policymakers and a lack of clear signals on jobs and inflation. Last Wednesday, the Fed funds futures market was pricing-in the probability of a third rate cut this year in the high 20% range. Following comments from New York Fed President John Williams on Friday indicating the possibility of lower interest rates in the near-term as the labor market softens, investors boosted the odds of a rate cut to around 70%. As the Thanksgiving holiday approaches and traders look to the Federal Reserve for indications of policy easing, traders are fully pricing in a quarter-point cut at the January meeting and an additional cut by the June 2026 meeting.
Slopes along the municipal yield curve are currently steepest around the 16-year tenor, with almost 75 bps in slope from 13 to 19-years. This is a significant change from earlier last month, when the steepest slopes were around the 10-year tenor. This shift has increased the reward to investors for extending from the 10-year range to the 15-20-year range. In addition, investors benefit from a steep roll-down over time. Although the municipal yield curve is currently rewarding duration, the long-end has become very flat with steadily declining slopes from 20 to 30-years and only a basis point or so per year past 25-years. As a result of this flat tail, municipal bond investors can buy maturities under 20-years that yield over 90% of the 30-year curve.

Elevated municipal tax-equivalent yields on the long-end continue to reward investors, with ratios generally cheapening over the past week. The muni/Treasury ratio is a widely watched measure that provides a sense of how tax-exempt munis fare against taxable fixed-income options. Crossover investors, which seek to identify the best opportunities in the fixed income universe on an after-tax basis, closely follow this ratio. Over the past week, the biggest moves have been in maturities around the 5 to 10-year mark where ratios have become almost 2% richer, with ratios now around 66.5% at 5-years. Over the past month, the biggest moves have been around the 20-year maturity where ratios are now about 2% richer. For investors seeking to maximize curve positioning with relative value, extending to the 18-year part of the municipal yield curve provides almost 90% of the 30-year maturity and almost 80% of equivalent Treasury yields.
Last week, the municipal bond market experienced uncharacteristically weak technical conditions as high deal volume was met by the largest outflows since the week ending April 16. Investors pulled $965.8 million from municipal bond mutual funds. This week, state and local governments bond issuance is expected to drop to $1.48b, due to the holiday week, with new issues expected to slow over the month. Notable deals this week include: Pennsylvania Housing Finance Agency selling $275 million and Keller Independent School District/Texas selling $99 million.
Herbert J. Sims & Co. Inc. is a SEC registered broker-dealer, a member of FINRA, SIPC. The information contained herein has been prepared based upon publicly available sources believed to be reliable; however, HJ Sims does not warrant its completeness or accuracy and no independent verification has been made as to its accuracy or completeness. The information contained has been prepared and is distributed solely for informational purposes and is not a solicitation or an offer to buy or sell any security or instrument or to participate in any trading or investment strategy, and is subject to change without notice. All investments include risks. Nothing in this message or report constitutes or should be construed to be accounting, tax, investment or legal advice.
Our team of market analysts have a singular mission: to help you make better investment decisions. Read the latest market commentary.
Continue reading