Curve Commentary: July 13, 2026

Overview

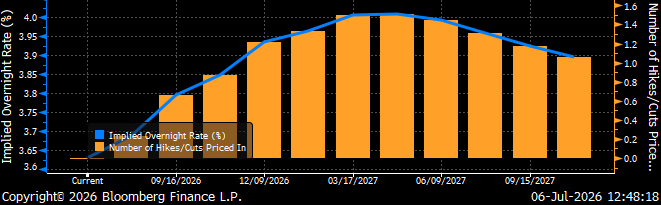
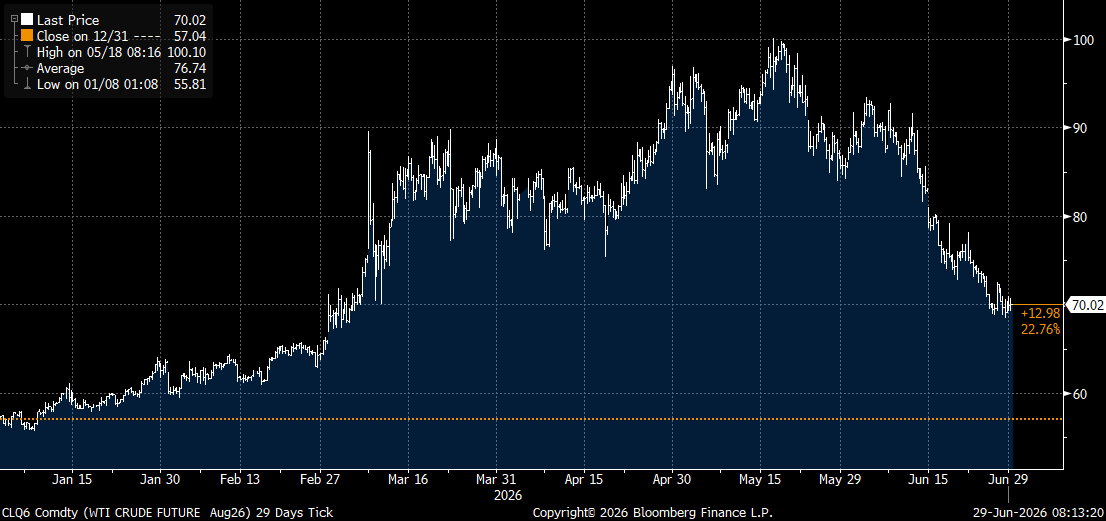
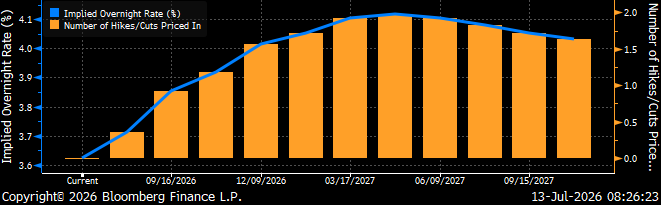
The war in Iran continues to make headlines with Iran reportedly insisting that ships obtain permission and the US declaring the Strait is open to all vessels.  This uncertainty has resulted in oil continuing to price at higher levels, West Texas Intermediate is back in the mid 70’s this morning.  Inflation concerns with higher energy prices continue to move the long-end of the Treasury yield curve, with maturities past 20-years now eclipsing 5%.  On the short-end, we are experiencing upward pressure around the policy sensitive 2-year tenor amid speculation the Fed will raise rates sooner rather than later.  Fed funds futures are now almost fully pricing in a rate hike of 25bp in September (92%), which, as of last week, was previously thought to not occur until December.  This week we will be closely following the US data on CPI and producer prices as they will be the final inflation prints before the Fed’s meeting later this month.

Implied Overnight Rate & Number of Hikes/Cuts
Insights and Strategy

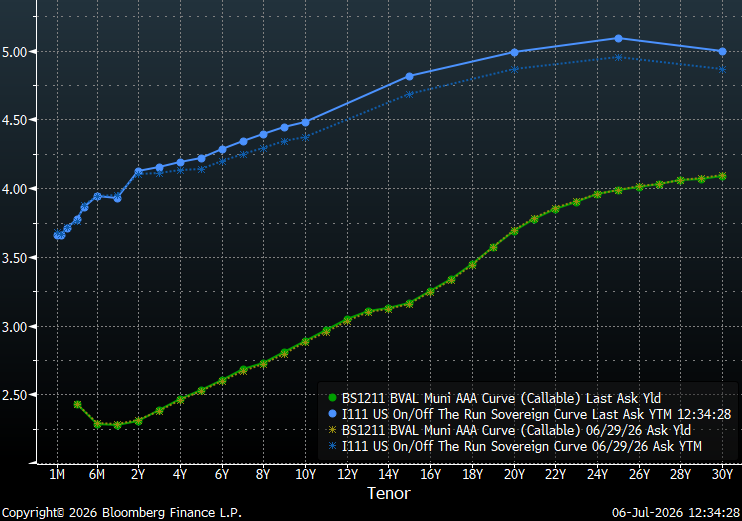
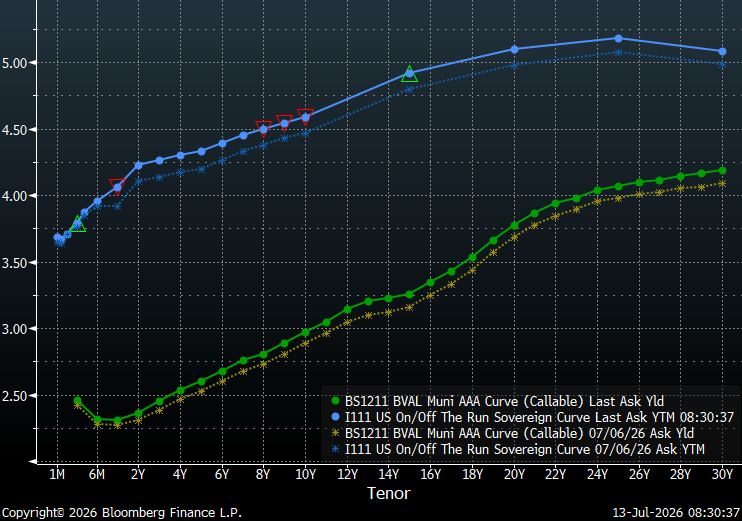
Treasury curves steepened a bit over the past week, while the municipal yield curve followed in sympathy.  However, the slope of the 10 to 30-year municipal curve remains near the tightest levels seen in over a year.  This flattening is the result of shifting expectation for longer maturities as markets adjust inflation expectations against the strength of the economy.  When comparing the municipal yield curve to the Treasury curve, the first 6 months immediately stand-out with the inverted shape of the municipal curve contrasting with the steeply sloped Treasury curve.  The slope at the long-end of the municipal yield curve, past 20-years, remains relatively flat with a total slope of 34 bps from 21-30-years.  Due to this flat tail, municipal bond investors can currently buy 20-year maturities that yield almost 90% of the 30-year curve versus 71% for 10-year maturities.
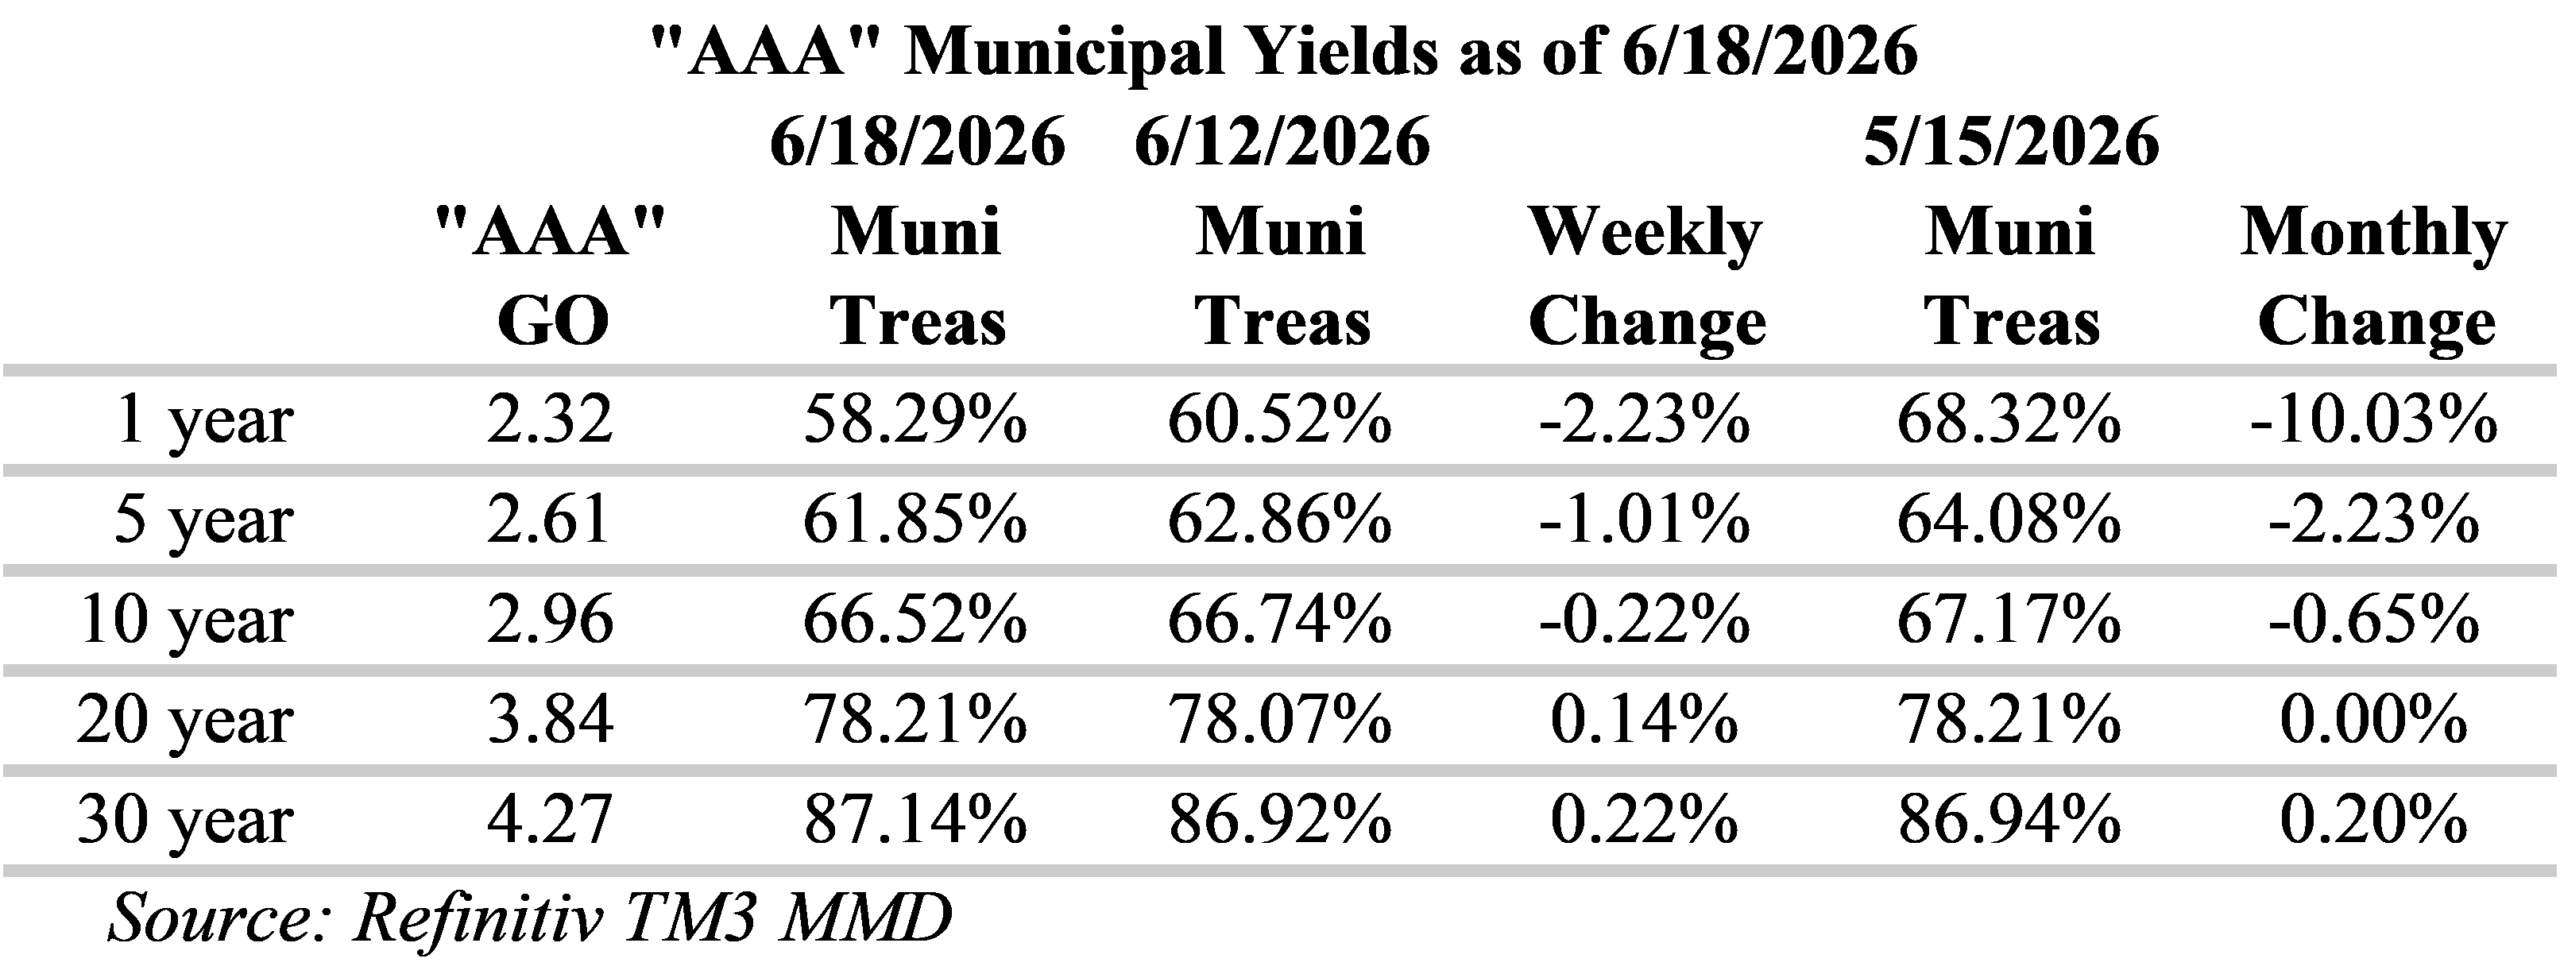
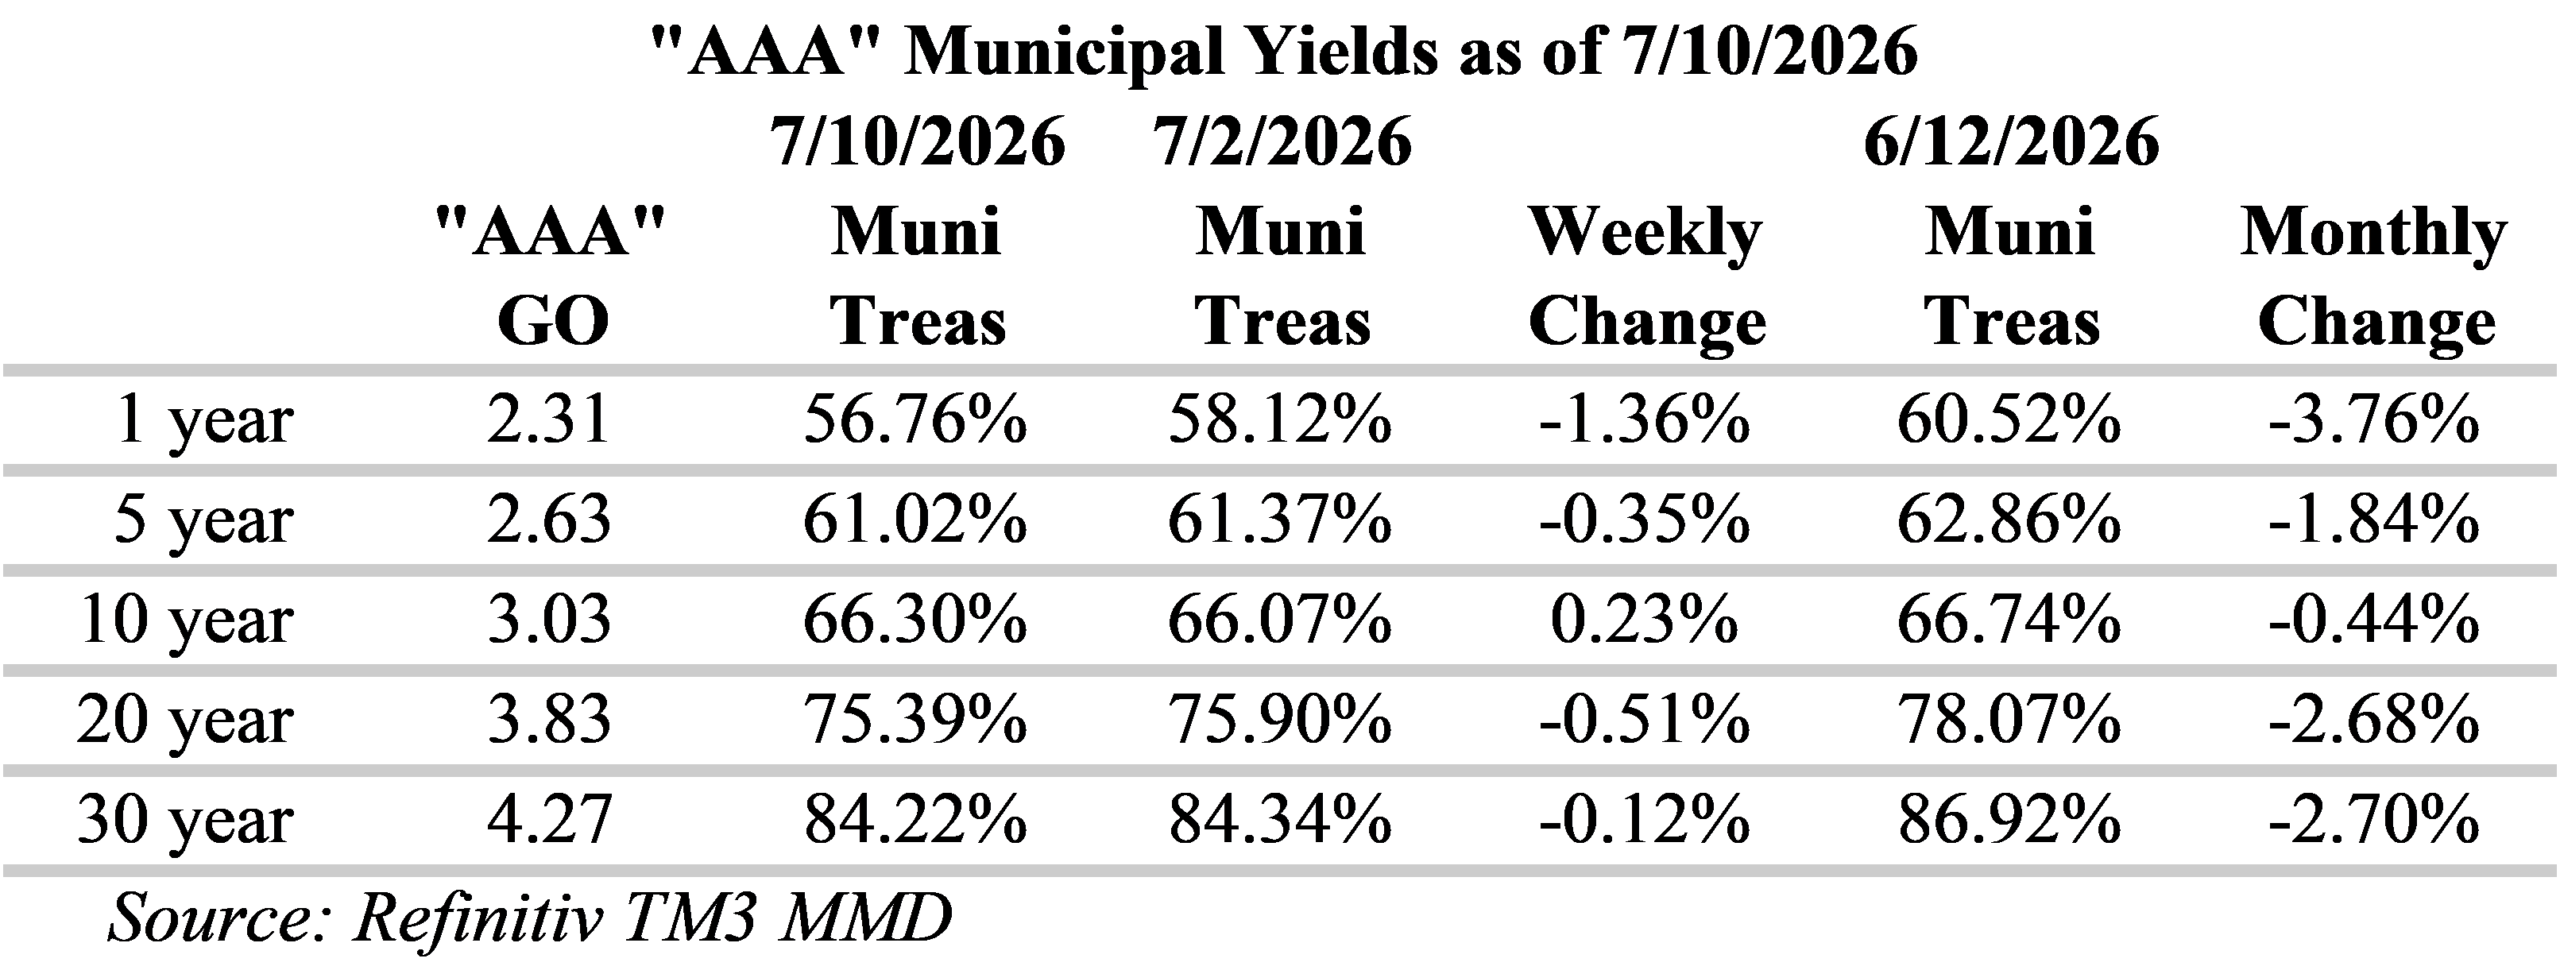
Over the past week, Municipal/Treasury ratios have generally decreased (richened), with one-year ratios notably well below 60%.  Furthermore, ratios have recently fallen well below several important reference points along the curve.  Ratios for 10-year municipal yields are now well under 70% of Treasuries, 20-year ratios are below 80% and 30-year ratios are below 90% of Treasuries.  For investors seeking to maximize curve positioning with relative value, the 19 to 21-year part of the municipal yield curve is attractive with slopes of 10 to 13-bps per year and yields around 80% of Treasuries.  Although ratios past 20-years are more attractive, relative to Treasuries, the yield curve is very flat over these longer tenors.
The Municipal the new issue calendar remains elevated this week with US state and local governments expected to sell around $12.5 billion of bonds.  Notable deals include: the New York State Thruway Authority, which plans to sell $2.44 billion; Aquarion Water Authority Water System, with $2.37 billion; New Jersey Turnpike Authority, with $1.06 billion; and, Norton Healthcare Obligated Group is expected to bring $504 million to the market.  In addition, technical conditions remain supportive of the primary market.  Last week, municipal bond investors added approximately $1.4 billion to municipal-bond funds, according to LSEG Lipper Global Fund Flows.

Herbert J. Sims & Co. Inc. is a SEC registered broker-dealer, a member of FINRA, SIPC. The information contained herein has been prepared based upon publicly available sources believed to be reliable; however, HJ Sims does not warrant its completeness or accuracy and no independent verification has been made as to its accuracy or completeness. The information contained has been prepared and is distributed solely for informational purposes and is not a solicitation or an offer to buy or sell any security or instrument or to participate in any trading or investment strategy, and is subject to change without notice. All investments include risks. Nothing in this message or report constitutes or should be construed to be accounting, tax, investment or legal advice.


The 24th Annual HJ Sims Late Winter Conference

Financing Methods and Operating Strategies for Charter Schools and Senior Living

Planning is underway for the 2027 HJ Sims Late Winter Conference, and it’s already shaping up to be an unforgettable experience. Join us for an energizing program featuring dynamic speakers, timely insights, and meaningful opportunities to connect with peers and industry leaders.

We’re thrilled to host our 24th annual conference at the stunning JW Marriott Starr Pass Resort & Spa in Tucson, Arizona

For conference attendance, follow our Safety Protocol.

We look forward to welcoming you to an exceptional conference in an unbeatable setting.

For more information, please contact Kat Dymond.


JEFFERSON EDUCATION CENTER Case Study (April 2026)

$5,600,000 | April 2026 | Louisville

Partnered Right®

HJ Sims partnered with Louisville Broadway Project, LLC, a student housing developer focused on purpose-built housing near higher education campuses, to support the acquisition of the Jefferson Education Center (JEC) located at 200 W. Broadway in downtown Louisville. The property is adjacent to the Jefferson Community & Technical College (JCTC) campus and is locally known for housing several JCTC administrative departments. The client identified the site as a strategic opportunity to address a growing
need for affordable, conveniently located student housing in downtown Louisville. The immediate financing need was to acquire the existing building while preserving
flexibility for future redevelopment. The acquisition represented the first phase of a broader development strategy that includes the construction of approximately 430 new student housing beds. HJ Sims’ experience in education-related real estate and student housing finance positioned the firm as a natural partner for the transaction.

Structured Right®

HJ Sims structured a private loan of approximately $5.6 million to finance the acquisition of the Jefferson Education Center. The financing structure was intentionally designed to align with the phased nature of the overall project, separating the near term acquisition from the future construction financing. This approach allowed the client to secure the property while maintaining flexibility for subsequent capital markets execution. The structure anticipates a later issuance of approximately $50 million privatized tax-exempt student housing bonds to finance the student housing improvements. By sequencing the financings, the plan of finance reduced execution risk and allowed the client to advance the project in a measured manner. The structure also accommodated the client’s intention to partner with the JCTC Foundation during the development phase. The financing will include a program of student support that will result in improved student retention, higher graduation rates, and wider career opportunities for students after they graduate. Overall, the financing strategy balanced immediate capital needs with long-term project goals.

Executed Right®

HJ Sims served as Placement Agent and successfully executed the private loan transaction on behalf of Louisville Broadway Project, LLC. The firm coordinated the financing process to support a timely closing, enabling the client to acquire a strategically located asset in downtown Louisville. Execution required careful coordination to align the acquisition timeline with the client’s broader development and partnership objectives. Throughout the process, HJ Sims provided hands-on guidance and capital markets expertise. The transaction was structured to support the client’s planned collaboration with the JCTC Foundation and future bond financing. The successful execution positioned the project to move seamlessly into its next phase. This transaction highlights HJ Sims’ ability to deliver customized solutions for complex education-adjacent real estate projects.

Financed Right®

The financing enabled the client to secure a highly strategic site adjacent to the JCTC campus and advance a transformative student housing development. The transaction established a clear path from acquisition through long-term development financing. As a result, the project is positioned to deliver meaningful benefits
to students and the surrounding academic community.

For more information on how this project was Financed Right® by HJ Sims, please contact:

Robert Nickell

214.681.0952

Tom Pitcher

435.529.8577

Testimonials may not be representative of the experience of other clients. Past performance is no guarantee of future results

Curve Commentary: July 6, 2026

Overview

The Bureau of Labor Statistics released its Employment Situation report last week that noted fewer-than-expected jobs added and a drop in the unemployment rate to 4.2%.  Recently, anxieties have been high regarding the potential for rate hikes under new Fed Chairman Kevin Warsh.  Following last week’s report, fed funds futures are now anticipating the Fed will hike rates 25bp in December which was previously thought to occur as soon as October.  Declining geopolitical tensions and oil prices combined with a more dovish outlook for the Fed could create an accommodative environment for the record issuance we have seen in the municipal market this year.

Implied Overnight Rate & Number of Hikes/Cuts

Insights and Strategy

Treasury curves steepened a bit over the past week, while the municipal yield curve is almost unchanged.  Currently, the slope of 10 to 30-year municipal curve is at the tightest levels seen in over a year.  This flattening is the result of longer maturities responding to declining inflation expectations.  When comparing the municipal yield curve to the Treasury curve, the first 6 months stand-out with the inverted shape of the municipal curve contrasting starkly with the steeply sloped Treasury curve.  Although the yield curve has flattened from 10 to 30-years, Investors continue be rewarded for extending out the yield curve with the steepest yields in the 19-21-year maturity range.  The slope at the long-end of the municipal curve, past 20-years, remains relatively flat with a total slope of 32 bps from 21-30-years.  Due to this flat tail, municipal bond investors can currently buy 20-year maturities that yield 90% of the 30-year curve versus 70% for 10-year maturities.

Municipal/Treasury ratios have generally decreased (richened), ratios are now one to two percent lower than a week ago.  Notably, one-year ratios are well below 60%.  Ratios on the long-end for 20-years and longer, are now meaningfully lower.  Municipals have recently fallen well below several important reference points along the curve.  Ratios for 10-year municipal yields are now well under 70% of Treasuries, 20-year ratios are below 80% and 30-year ratios are below 90% of Treasuries.  For investors seeking to maximize curve positioning with relative value, the 19 to 21-year part of the municipal yield curve is attractive with slopes of 10 to 13-bps per year and yields around 80% of Treasuries.  Although ratios past 20-years are more attractive, relative to Treasuries, the yield curve is very flat over these longer tenors. 

Following last week’s holiday closures, the Municipal the new issue calendar is significantly higher with US state and local governments expected to sell around $15.1 billion of bonds.  Notable deals include: Aquarion Water Authority Water System Revenue Bonds with $2.37 billion, California State University has scheduled $1.8 billion, Massachusetts Port Authority is expected to offer $812 million and Massachusetts Bay Transportation Authority Sales Tax Revenue has $767.4 million on the calendar.  In addition, technical conditions remain supportive of the primary market.  Last week, municipal bond investors added approximately $1.7 billion to municipal-bond funds, according to LSEG Lipper Global Fund Flows.

Herbert J. Sims & Co. Inc. is a SEC registered broker-dealer, a member of FINRA, SIPC. The information contained herein has been prepared based upon publicly available sources believed to be reliable; however, HJ Sims does not warrant its completeness or accuracy and no independent verification has been made as to its accuracy or completeness. The information contained has been prepared and is distributed solely for informational purposes and is not a solicitation or an offer to buy or sell any security or instrument or to participate in any trading or investment strategy, and is subject to change without notice. All investments include risks. Nothing in this message or report constitutes or should be construed to be accounting, tax, investment or legal advice.

Curve Commentary: June 29, 2026

Overview

Following an escalation of tensions in the Strait of Hormuz, Iran and the US have reportedly agreed to stop mutual attacks.  Although there is an agreement in place, shipowners remain wary of crossing the strait.  As a result, oil prices are up again this morning and we are seeing Treasuries trade off a bit, particularly in the intermediate portion of the yield curve.  While this week is a holiday week with a lighter new issue calendar, accounts are likely to be attentive with over $100 billion in combined July and August redemptions.

West Texas Intermediate Crude Futures

Insights and Strategy

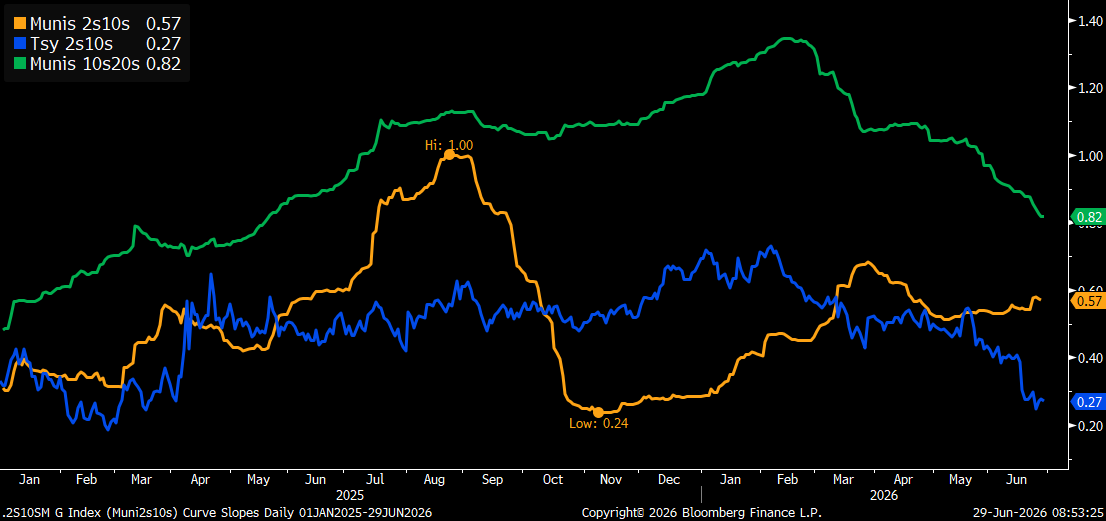
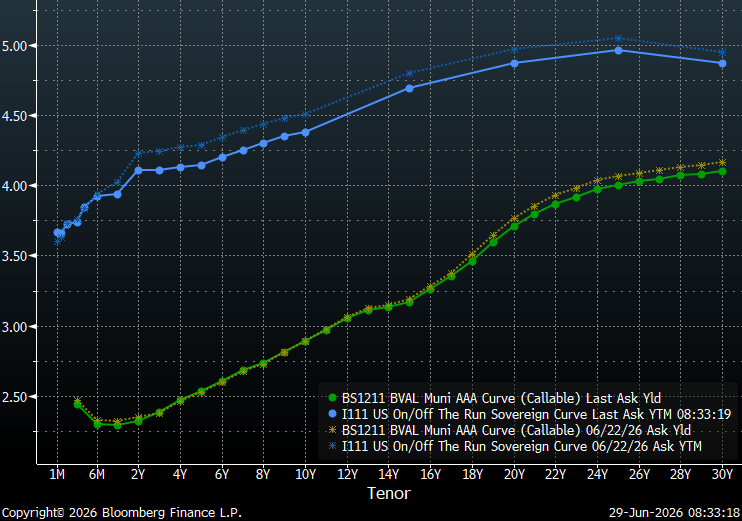
Both municipal and Treasury curves have flattened over the past week.  Currently, the slope of 2 to 10-year Treasuries is less than half of what it was in mid-May and near the tightest levels seen in over a year.  This flattening is the result of shorter-dated Treasuries anticipating rate hikes while longer maturities face inflation uncertainties.  However, the first 6 months of the curves could not be more different, with munis inverted and Treasuries steeply upwardly sloped.  Although the yield curve has flattened, Investors continue be rewarded for extending out the yield curve with the steepest yields in the 19-21-year maturity range.  The slope at the long-end of the municipal yield curve, past 20-years, remains relatively flat with a total slope of 31 bps from 21-30-years.  Due to this flat tail, municipal bond investors can currently buy 20-year maturities that yield over 90% of the 30-year curve versus 70% for 10-year maturities.

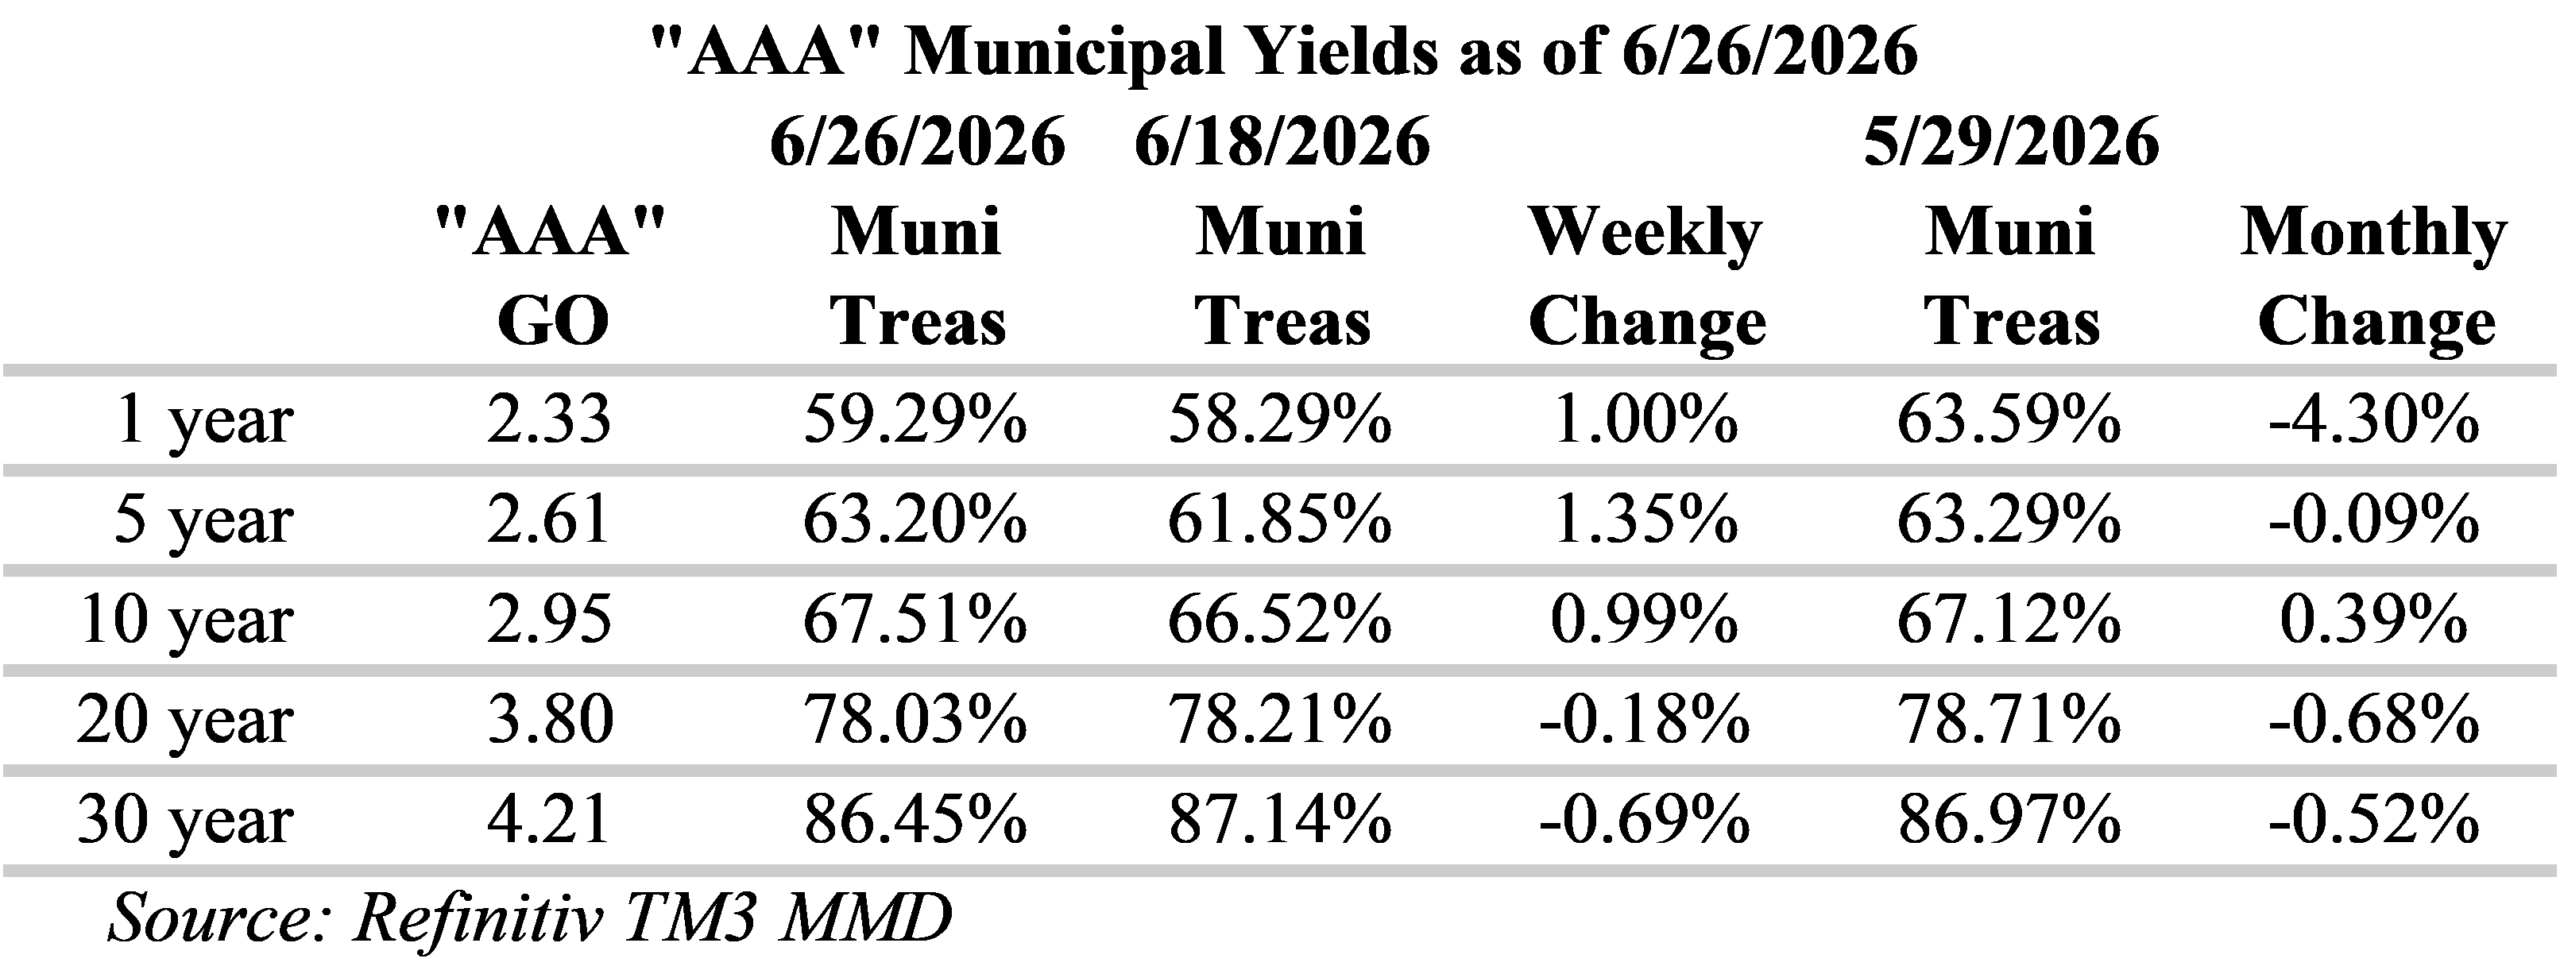
Municipal/Treasury ratios have generally increased (cheapened) for periods shorter than 10-years, with one-year ratios 1% higher, but still below 60% of Treasuries.  Ratios on the long-end, for 20-yewars and longer, are now slightly lower.  Municipals have fallen well below several important reference points along the curve.  Ratios for 10-year municipal yields are now well under 70% of Treasuries, 20-year ratios are below 80% and 30-year ratios are below 90% of Treasuries.  For investors seeking to maximize curve positioning with relative value, the 19 to 21-year part of the municipal yield curve is attractive with slopes of 10 to 13-bps per year and yields around 80% of Treasuries.  Although ratios past 20-years are more attractive, relative to Treasuries, the yield curve is very flat over these longer tenors.

Due to the holiday closure later this week, the Municipal the new issue calendar is significantly smaller with US state and local governments expected to sell around $7 billion of bonds.  Notable deals include: Black Belt Energy Gas District with $920 million, Massachusetts Port Authority is expected to bring $812 million, Main Street Energy Inc. has scheduled $585 million and City of San Diego Water has $429.9 million on the calendar.  In addition, technical conditions remain supportive of the primary market.  Last week, municipal bond investors added approximately $633 million to municipal-bond funds, according to LSEG Lipper Global Fund Flows.

Herbert J. Sims & Co. Inc. is a SEC registered broker-dealer, a member of FINRA, SIPC. The information contained herein has been prepared based upon publicly available sources believed to be reliable; however, HJ Sims does not warrant its completeness or accuracy and no independent verification has been made as to its accuracy or completeness. The information contained has been prepared and is distributed solely for informational purposes and is not a solicitation or an offer to buy or sell any security or instrument or to participate in any trading or investment strategy, and is subject to change without notice. All investments include risks. Nothing in this message or report constitutes or should be construed to be accounting, tax, investment or legal advice.

Curve Commentary: June 22, 2026

Overview

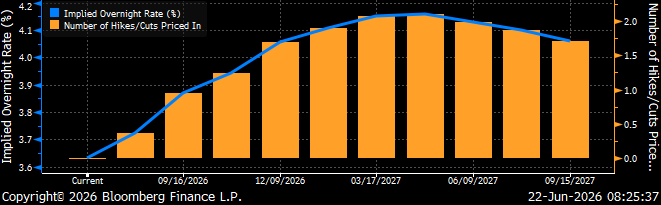
Last week the Federal Open Market Committee (FOMC) voted to hold the benchmark federal funds rate in a range of 3.5% to 3.75%, at the first gathering with Kevin Warsh as “Chairman.”  At the meeting, officials signaled growing support for rate hikes this year with half of the individual Fed members expecting to raise rates by the end of the year.  Furthermore, Warsh repeatedly reiterated the Fed’s commitment to fighting inflation.  Fed rate-hike expectations have recently shortened significantly with Fed Funds Futures pricing in two 25bp moves by March 2027.  Fed funds futures are now anticipating the Fed will hike rates 25bp as soon as October.

Implied Overnight Rate & Number of Hikes/Cuts

Insights and Strategy

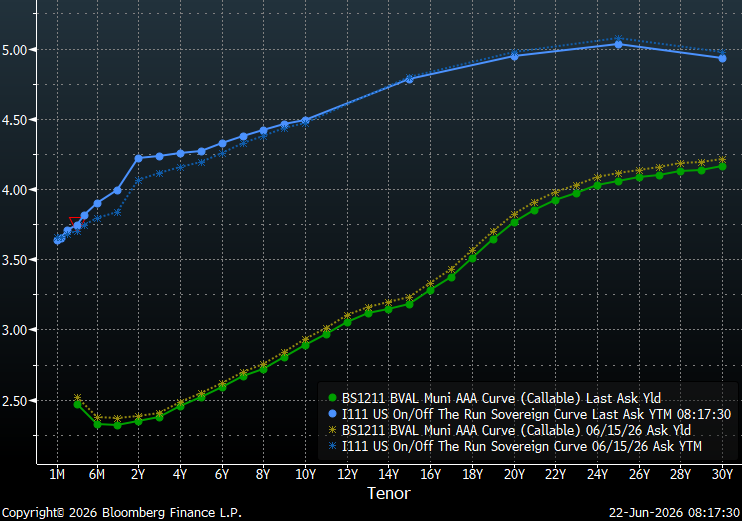
The gap between two- and 10-year Treasury yields and between five- and 30-year yields has narrowed to the tightest levels in more than a year.  This flattening is the result of shorter-dated Treasuries anticipating rate hikes while longer maturities price-in a tougher inflation stance.  However, the municipal yield curve has responded in a more even fashion with an almost parallel shift downward with the first six-months remaining inverted.  Although the yield curve has flattened, Investors continue to be rewarded for extending out the yield curve, with the steepest yields in the 18-21-year maturity range.  The slope at the long-end of the municipal yield curve, past 20-years, remains relatively flat with a total slope of 31 bps from 21-30-years.  Due to this flat tail, municipal bond investors can currently buy 20-year maturities that yield almost 90% of the 30-year curve versus less than 70% for 10-year maturities.

Over the past week, municipal/Treasury ratios have generally declined for periods shorter than 10-years, with one-year ratios now well below 60%.  Ratios on the long-end, for 20-yewars and longer, are now slightly higher.  Municipals have now fallen well below several important reference points along the curve.  Ratios for 10-year municipal yields are now well under 70% of Treasuries, 20-year ratios are below 80% and 30-year ratios are below 90% of Treasuries.  For investors seeking to maximize curve positioning with relative value, the 19 to 21-year part of the municipal yield curve is attractive with slopes of 12 to 13-bps per year and yields around 80% of Treasuries.  Although ratios past 20-years are more attractive, relative to Treasuries, the yield curve is very flat over these longer tenors.

The Municipal the new issue calendar remains relatively robust this week with US state and local governments expected to sell over $12 billion of bonds.  Notable deals include: the State of Georgia with $1.57 billion, Massachusetts Bay Transportation Authority Sales Tax Revenue is scheduled to sell $767.4 million, Santa Clara Unified School District is selling $438 million and Central Florida Expressway Authority is expected to bring $430.6 million to the market.  In addition, technical conditions remain supportive of the primary market.  Last week, municipal bond investors added approximately $1.19 billion to municipal-bond funds, according to LSEG Lipper Global Fund Flows.  Furthermore, June tax-exempt reinvestment proceeds are expected to reach approximately$54.5 billion.

Herbert J. Sims & Co. Inc. is a SEC registered broker-dealer, a member of FINRA, SIPC. The information contained herein has been prepared based upon publicly available sources believed to be reliable; however, HJ Sims does not warrant its completeness or accuracy and no independent verification has been made as to its accuracy or completeness. The information contained has been prepared and is distributed solely for informational purposes and is not a solicitation or an offer to buy or sell any security or instrument or to participate in any trading or investment strategy, and is subject to change without notice. All investments include risks. Nothing in this message or report constitutes or should be construed to be accounting, tax, investment or legal advice.