
Overview
This morning we were welcomed by green screens as Treasuries advanced following weeks of selling. Nevertheless, Day-to-day volatility remains high in the fixed income markets with the war in the Middle East continuing to dominate headlines and what the media is referring to as the biggest oil supply shock in history. The war is now in its second month and the rate cuts investors have been anticipating over the past year are appearing increasingly less likely. Not surprisingly, pricing in the Fed funds futures market has fluctuated dramatically over this past week with current pricing indicating only the chance of a cut over the next year.
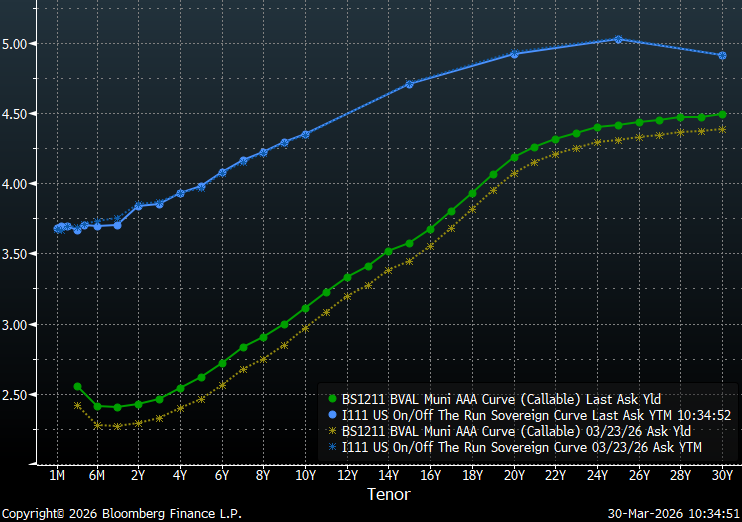
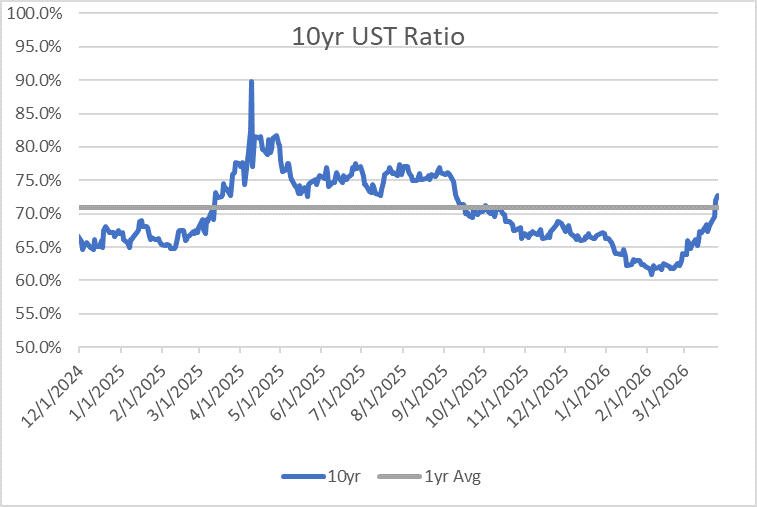
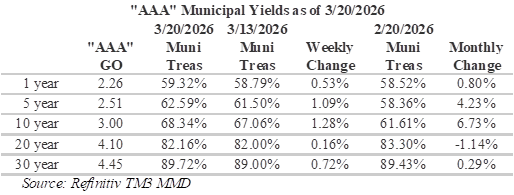
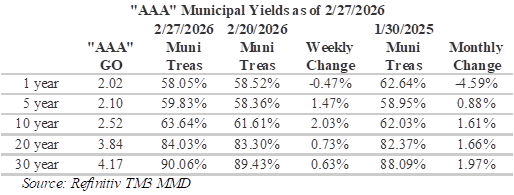
Treasuries have generally performed better than munis over the past week, leaving the Treasury yield curve essentially unchanged while munis are roughly 10 to 16 bps higher, depending upon the maturity. The intermediate portion of the muni curve experienced the biggest moves, with maturities from four to 11-years now as much as 16 bps higher. On the trade desk we have previously noted that new issue supply and a lack of inquiry have lead to weakness around the 10-year maturity while trading has become relaxed on the short-end with muni/Treasury ratios loosening up. As a result, municipal/Treasury ratios have increasingly become more appealing around the 10-year tenor with ratios now over 70%. As a result, this has become a significantly more appealing portion of the curve to position.
Insights and Strategy
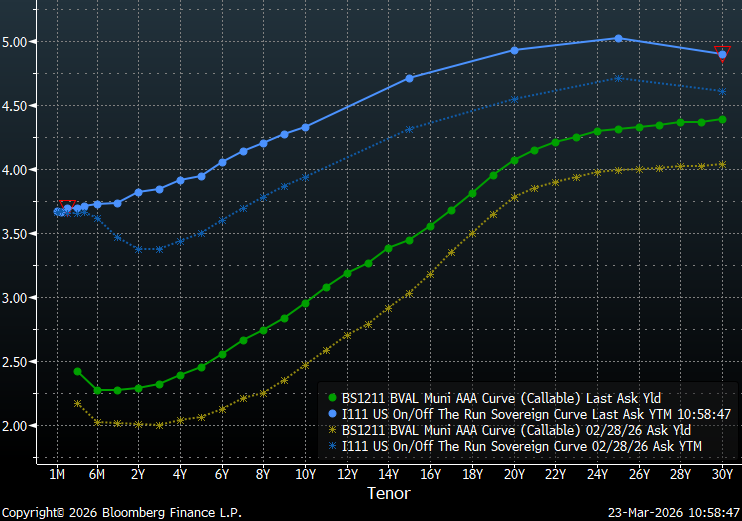
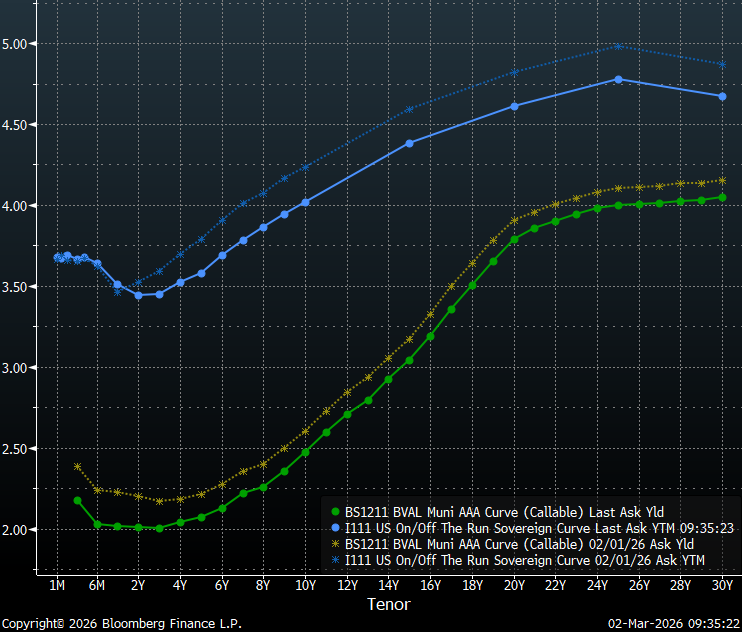
Despite shifting muni/Treasury ratios, slopes along the municipal yield curve continue to reward extending duration. Investors are encouraged to extend out the yield curve with appealingly steep yields in the four to 12-year range, with an overall slope of 87 bps. Furthermore, the steepest slopes along the yield curve are currently around the 17- 20-year maturities with approximately 12-bps per year of additional yield for extending in this range. However, the yield curve becomes very flat past 20-years, with a total slope of 24 bps from 20-30-years.
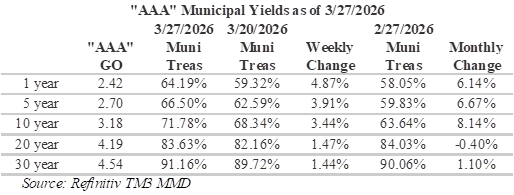
Ratios for muni maturities shorter than 1-year are yielding almost 65% of Treasuries while 30-year munis are now yielding over 90% of equivalent Treasuries. Although ratios past 20-years are attractively priced relative to Treasuries, the yield curve remains very flat over these longer tenors. Due to the flat tail, municipal bond investors can currently buy maturities under 20-years that yield almost 90% of the 30-year curve. For investors seeking to maximize curve positioning with relative value, the 17 to 20-year part of the municipal yield curve has become very tempting with a combination of steep slopes and attractive relative yields.
This week, a combination of a more modest new issue calendar and $19.7 billion in maturing principal and interest coming due on April 1, should conspire to create a more favorable environment for munis. Notable deals include: Black Belt Energy Gas District, which plans to sell $1 billion; East Bay municipal Utility District is scheduled to sell $694.3 million, and the Michigan State Housing Development Authority is expected to sell $568 million. According to LSEG Lipper Global Fund Flows, investors pulled roughly $600 million from municipal bond funds last week. Long-term funds reportedly saw outflows of $905 million and high-yield funds saw outflows of $606 million while intermediate-maturity funds received $193 million. Considering recent developments in muni/Treasury ratios, it should come as no surprise that the majority of inflows are going to intermediate funds.
Herbert J. Sims & Co. Inc. is a SEC registered broker-dealer, a member of FINRA, SIPC. The information contained herein has been prepared based upon publicly available sources believed to be reliable; however, HJ Sims does not warrant its completeness or accuracy and no independent verification has been made as to its accuracy or completeness. The information contained has been prepared and is distributed solely for informational purposes and is not a solicitation or an offer to buy or sell any security or instrument or to participate in any trading or investment strategy, and is subject to change without notice. All investments include risks. Nothing in this message or report constitutes or should be construed to be accounting, tax, investment or legal advice.


")
