HJ Sims Provides $2.9 Million
Mezzanine Loan for Skilled Nursing and
Assisted Living Acquisition

HJ Sims Provides $2.9 Million
Mezzanine Loan for Skilled Nursing and
Assisted Living Acquisition
HJ Sims Provides $4.3 Million
Mezzanine Loan for Skilled Nursing
Acquisition
HJ Sims Partners with Hózhó
Academy to Finance Campus
Expansion and Facility
Enhancements
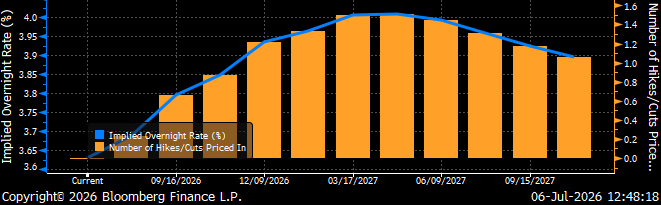
The Bureau of Labor Statistics released its Employment Situation report last week that noted fewer-than-expected jobs added and a drop in the unemployment rate to 4.2%. Recently, anxieties have been high regarding the potential for rate hikes under new Fed Chairman Kevin Warsh. Following last week’s report, fed funds futures are now anticipating the Fed will hike rates 25bp in December which was previously thought to occur as soon as October. Declining geopolitical tensions and oil prices combined with a more dovish outlook for the Fed could create an accommodative environment for the record issuance we have seen in the municipal market this year.
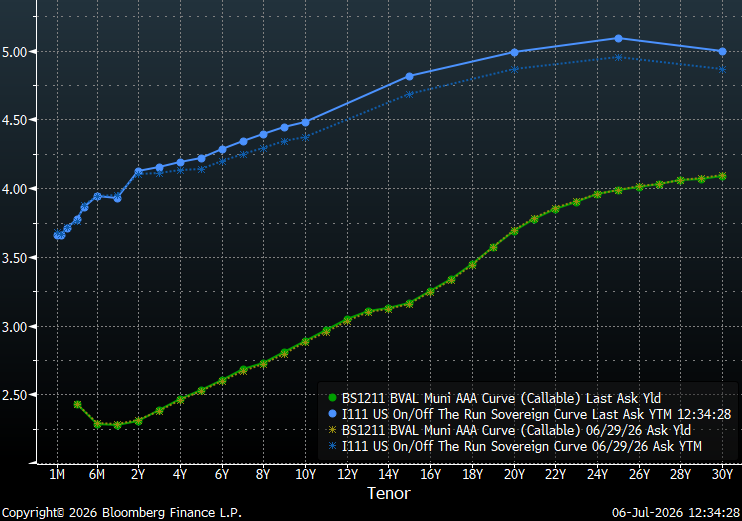
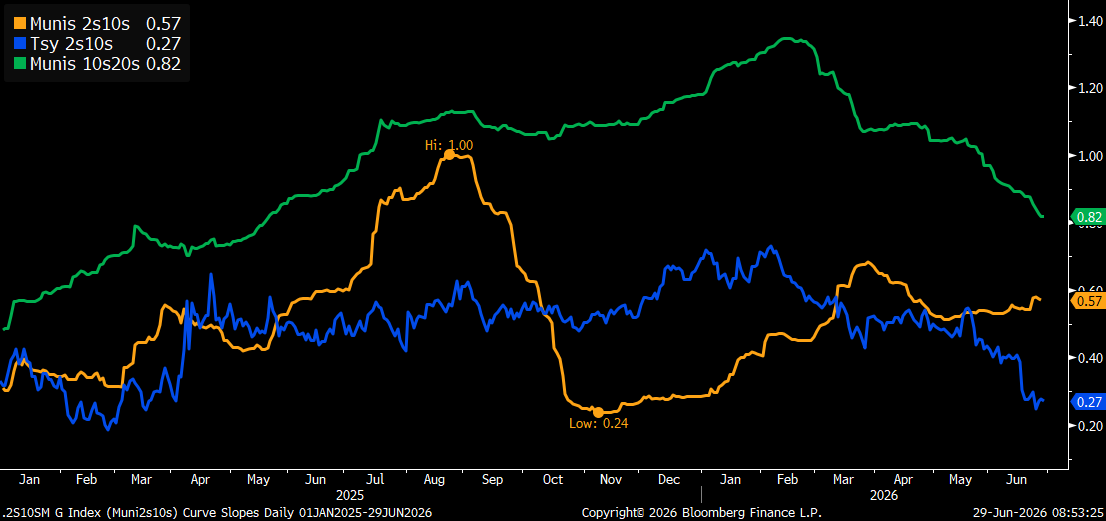
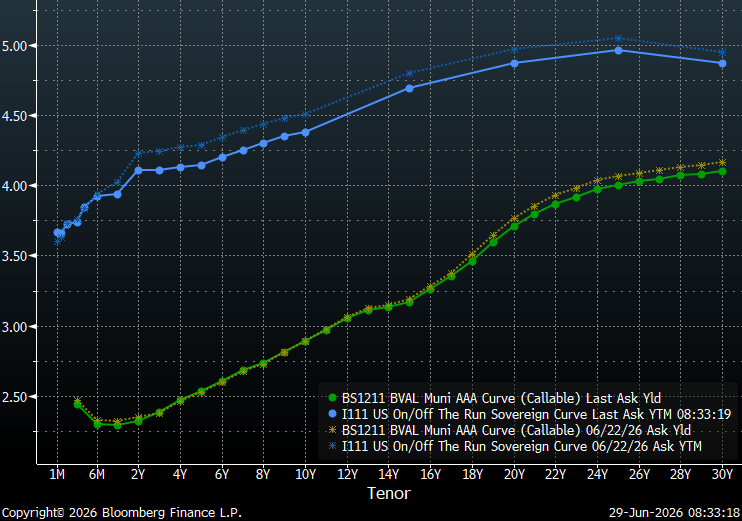
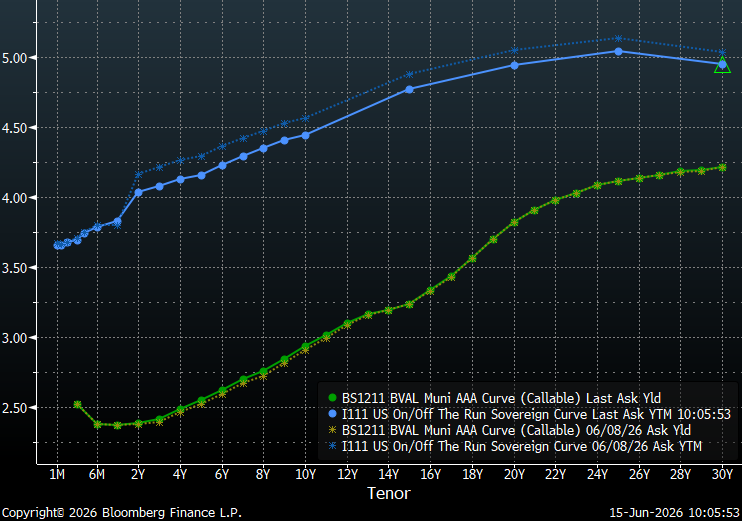
Treasury curves steepened a bit over the past week, while the municipal yield curve is almost unchanged. Currently, the slope of 10 to 30-year municipal curve is at the tightest levels seen in over a year. This flattening is the result of longer maturities responding to declining inflation expectations. When comparing the municipal yield curve to the Treasury curve, the first 6 months stand-out with the inverted shape of the municipal curve contrasting starkly with the steeply sloped Treasury curve. Although the yield curve has flattened from 10 to 30-years, Investors continue be rewarded for extending out the yield curve with the steepest yields in the 19-21-year maturity range. The slope at the long-end of the municipal curve, past 20-years, remains relatively flat with a total slope of 32 bps from 21-30-years. Due to this flat tail, municipal bond investors can currently buy 20-year maturities that yield 90% of the 30-year curve versus 70% for 10-year maturities.
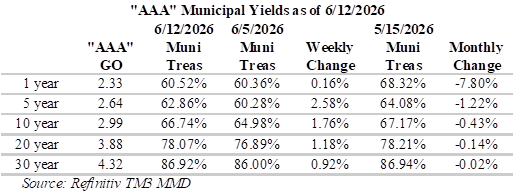
Municipal/Treasury ratios have generally decreased (richened), ratios are now one to two percent lower than a week ago. Notably, one-year ratios are well below 60%. Ratios on the long-end for 20-years and longer, are now meaningfully lower. Municipals have recently fallen well below several important reference points along the curve. Ratios for 10-year municipal yields are now well under 70% of Treasuries, 20-year ratios are below 80% and 30-year ratios are below 90% of Treasuries. For investors seeking to maximize curve positioning with relative value, the 19 to 21-year part of the municipal yield curve is attractive with slopes of 10 to 13-bps per year and yields around 80% of Treasuries. Although ratios past 20-years are more attractive, relative to Treasuries, the yield curve is very flat over these longer tenors.

Following last week’s holiday closures, the Municipal the new issue calendar is significantly higher with US state and local governments expected to sell around $15.1 billion of bonds. Notable deals include: Aquarion Water Authority Water System Revenue Bonds with $2.37 billion, California State University has scheduled $1.8 billion, Massachusetts Port Authority is expected to offer $812 million and Massachusetts Bay Transportation Authority Sales Tax Revenue has $767.4 million on the calendar. In addition, technical conditions remain supportive of the primary market. Last week, municipal bond investors added approximately $1.7 billion to municipal-bond funds, according to LSEG Lipper Global Fund Flows.
Herbert J. Sims & Co. Inc. is a SEC registered broker-dealer, a member of FINRA, SIPC. The information contained herein has been prepared based upon publicly available sources believed to be reliable; however, HJ Sims does not warrant its completeness or accuracy and no independent verification has been made as to its accuracy or completeness. The information contained has been prepared and is distributed solely for informational purposes and is not a solicitation or an offer to buy or sell any security or instrument or to participate in any trading or investment strategy, and is subject to change without notice. All investments include risks. Nothing in this message or report constitutes or should be construed to be accounting, tax, investment or legal advice.
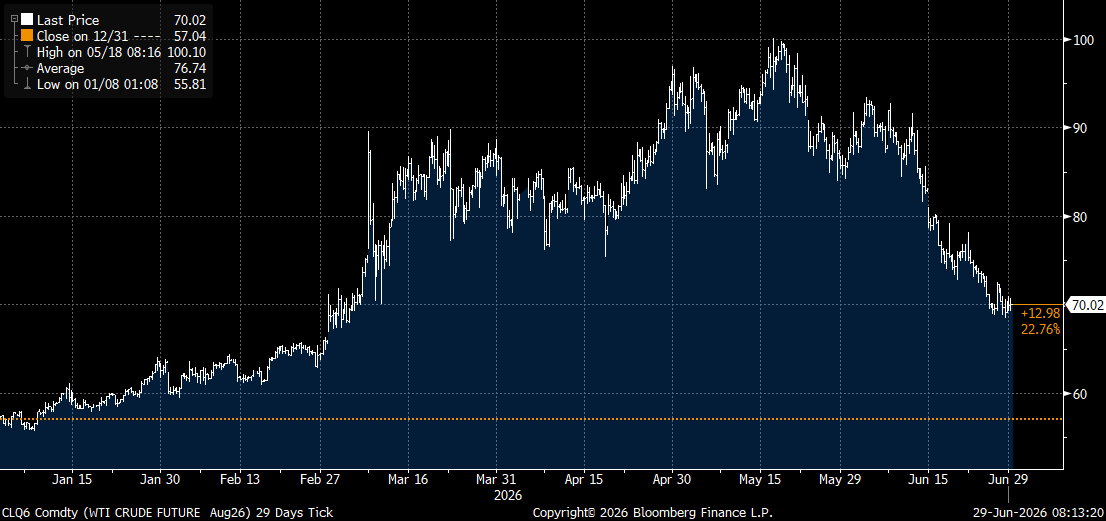
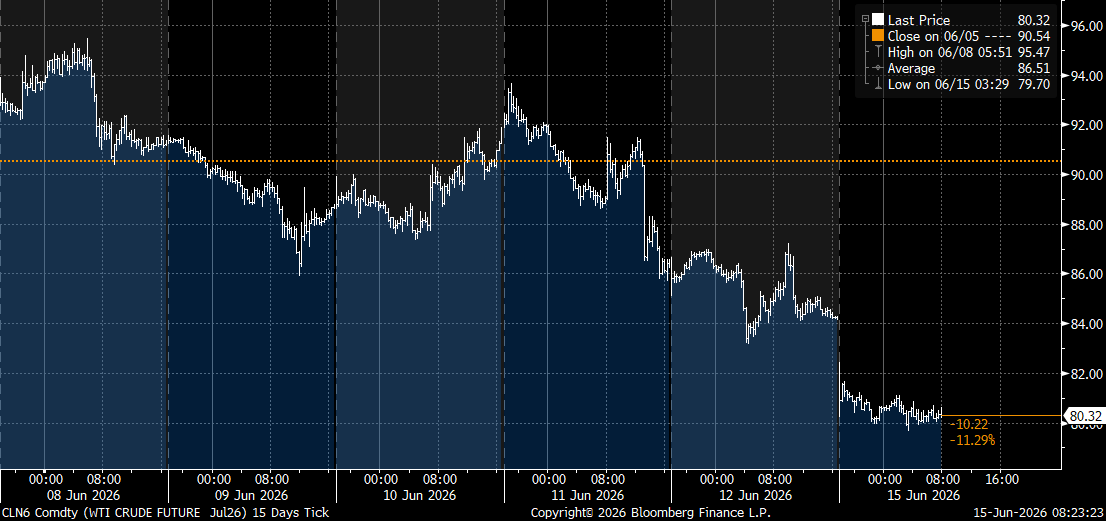
Following an escalation of tensions in the Strait of Hormuz, Iran and the US have reportedly agreed to stop mutual attacks. Although there is an agreement in place, shipowners remain wary of crossing the strait. As a result, oil prices are up again this morning and we are seeing Treasuries trade off a bit, particularly in the intermediate portion of the yield curve. While this week is a holiday week with a lighter new issue calendar, accounts are likely to be attentive with over $100 billion in combined July and August redemptions.
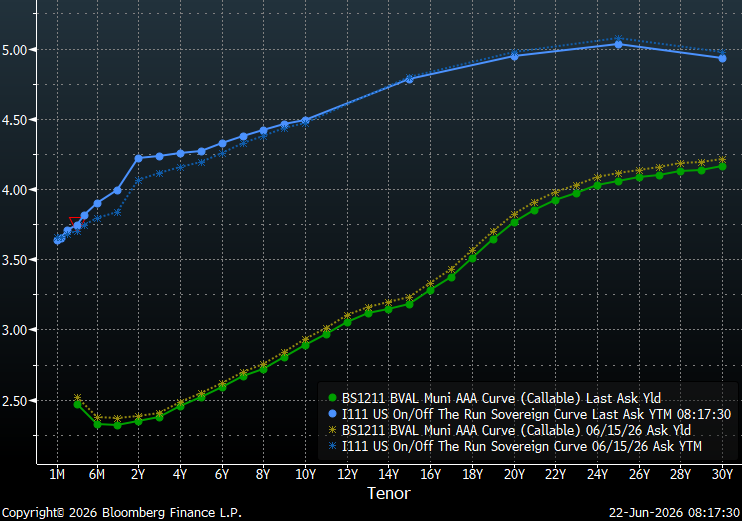
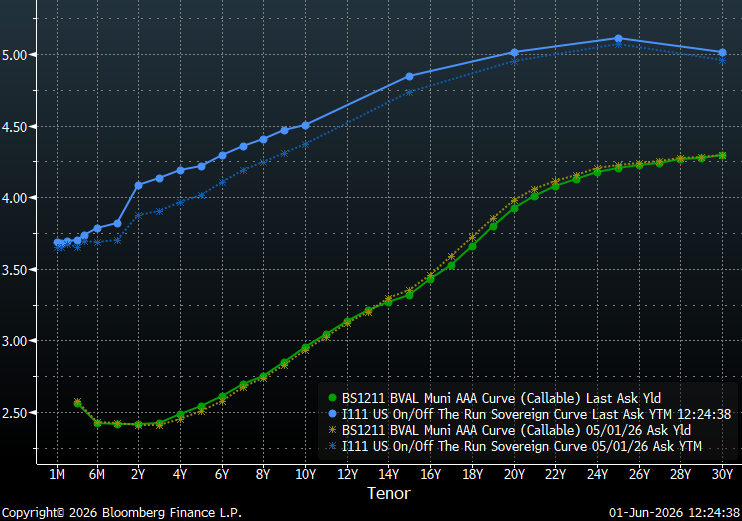
Both municipal and Treasury curves have flattened over the past week. Currently, the slope of 2 to 10-year Treasuries is less than half of what it was in mid-May and near the tightest levels seen in over a year. This flattening is the result of shorter-dated Treasuries anticipating rate hikes while longer maturities face inflation uncertainties. However, the first 6 months of the curves could not be more different, with munis inverted and Treasuries steeply upwardly sloped. Although the yield curve has flattened, Investors continue be rewarded for extending out the yield curve with the steepest yields in the 19-21-year maturity range. The slope at the long-end of the municipal yield curve, past 20-years, remains relatively flat with a total slope of 31 bps from 21-30-years. Due to this flat tail, municipal bond investors can currently buy 20-year maturities that yield over 90% of the 30-year curve versus 70% for 10-year maturities.
Municipal/Treasury ratios have generally increased (cheapened) for periods shorter than 10-years, with one-year ratios 1% higher, but still below 60% of Treasuries. Ratios on the long-end, for 20-yewars and longer, are now slightly lower. Municipals have fallen well below several important reference points along the curve. Ratios for 10-year municipal yields are now well under 70% of Treasuries, 20-year ratios are below 80% and 30-year ratios are below 90% of Treasuries. For investors seeking to maximize curve positioning with relative value, the 19 to 21-year part of the municipal yield curve is attractive with slopes of 10 to 13-bps per year and yields around 80% of Treasuries. Although ratios past 20-years are more attractive, relative to Treasuries, the yield curve is very flat over these longer tenors.

Due to the holiday closure later this week, the Municipal the new issue calendar is significantly smaller with US state and local governments expected to sell around $7 billion of bonds. Notable deals include: Black Belt Energy Gas District with $920 million, Massachusetts Port Authority is expected to bring $812 million, Main Street Energy Inc. has scheduled $585 million and City of San Diego Water has $429.9 million on the calendar. In addition, technical conditions remain supportive of the primary market. Last week, municipal bond investors added approximately $633 million to municipal-bond funds, according to LSEG Lipper Global Fund Flows.
Herbert J. Sims & Co. Inc. is a SEC registered broker-dealer, a member of FINRA, SIPC. The information contained herein has been prepared based upon publicly available sources believed to be reliable; however, HJ Sims does not warrant its completeness or accuracy and no independent verification has been made as to its accuracy or completeness. The information contained has been prepared and is distributed solely for informational purposes and is not a solicitation or an offer to buy or sell any security or instrument or to participate in any trading or investment strategy, and is subject to change without notice. All investments include risks. Nothing in this message or report constitutes or should be construed to be accounting, tax, investment or legal advice.

HJ Sims is proud to be attending and speaking at the LeadingAge Illinois Annual Conference.
Attendees: Lynn Daly
Speaking Session Details:
Lynn Daly, Executive Vice President, HJ Sims
Topic: The Value of Partnerships as a Model for Strategic Growth
When: July 14, 1pm CT
Session Objectives:

HJ Sims is proud to be attending and speaking at the CCRC Summit.
Andrew Nesi, Executive Vice President will be speaking on the below topic:
Senior Living Capital Markets Update
Date/Time: July 14, 2026 / 1:45 PM-2:45 PM ET
Session Description: This session will provide CCRC leaders with a strategic update on senior living capital markets, including trends in lending, interest rates, investor activity, and access to capital. Attendees will gain insight into the market forces shaping financing decisions and what they mean for providers’ planning, growth, and long-term strategy.
Attendees: Andrew Nesi
HJ Sims is proud to be attending and sponsoring at the NC Association of Public Charter Schools Conference.

Our team of market analysts have a singular mission: to help you make better investment decisions. Read the latest market commentary.
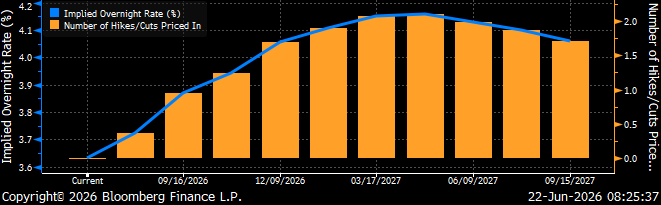
Continue readingLast week the Federal Open Market Committee (FOMC) voted to hold the benchmark federal funds rate in a range of 3.5% to 3.75%, at the first gathering with Kevin Warsh as “Chairman.” At the meeting, officials signaled growing support for rate hikes this year with half of the individual Fed members expecting to raise rates by the end of the year. Furthermore, Warsh repeatedly reiterated the Fed’s commitment to fighting inflation. Fed rate-hike expectations have recently shortened significantly with Fed Funds Futures pricing in two 25bp moves by March 2027. Fed funds futures are now anticipating the Fed will hike rates 25bp as soon as October.
The gap between two- and 10-year Treasury yields and between five- and 30-year yields has narrowed to the tightest levels in more than a year. This flattening is the result of shorter-dated Treasuries anticipating rate hikes while longer maturities price-in a tougher inflation stance. However, the municipal yield curve has responded in a more even fashion with an almost parallel shift downward with the first six-months remaining inverted. Although the yield curve has flattened, Investors continue to be rewarded for extending out the yield curve, with the steepest yields in the 18-21-year maturity range. The slope at the long-end of the municipal yield curve, past 20-years, remains relatively flat with a total slope of 31 bps from 21-30-years. Due to this flat tail, municipal bond investors can currently buy 20-year maturities that yield almost 90% of the 30-year curve versus less than 70% for 10-year maturities.
Over the past week, municipal/Treasury ratios have generally declined for periods shorter than 10-years, with one-year ratios now well below 60%. Ratios on the long-end, for 20-yewars and longer, are now slightly higher. Municipals have now fallen well below several important reference points along the curve. Ratios for 10-year municipal yields are now well under 70% of Treasuries, 20-year ratios are below 80% and 30-year ratios are below 90% of Treasuries. For investors seeking to maximize curve positioning with relative value, the 19 to 21-year part of the municipal yield curve is attractive with slopes of 12 to 13-bps per year and yields around 80% of Treasuries. Although ratios past 20-years are more attractive, relative to Treasuries, the yield curve is very flat over these longer tenors.

The Municipal the new issue calendar remains relatively robust this week with US state and local governments expected to sell over $12 billion of bonds. Notable deals include: the State of Georgia with $1.57 billion, Massachusetts Bay Transportation Authority Sales Tax Revenue is scheduled to sell $767.4 million, Santa Clara Unified School District is selling $438 million and Central Florida Expressway Authority is expected to bring $430.6 million to the market. In addition, technical conditions remain supportive of the primary market. Last week, municipal bond investors added approximately $1.19 billion to municipal-bond funds, according to LSEG Lipper Global Fund Flows. Furthermore, June tax-exempt reinvestment proceeds are expected to reach approximately$54.5 billion.
Herbert J. Sims & Co. Inc. is a SEC registered broker-dealer, a member of FINRA, SIPC. The information contained herein has been prepared based upon publicly available sources believed to be reliable; however, HJ Sims does not warrant its completeness or accuracy and no independent verification has been made as to its accuracy or completeness. The information contained has been prepared and is distributed solely for informational purposes and is not a solicitation or an offer to buy or sell any security or instrument or to participate in any trading or investment strategy, and is subject to change without notice. All investments include risks. Nothing in this message or report constitutes or should be construed to be accounting, tax, investment or legal advice.
Our team of market analysts have a singular mission: to help you make better investment decisions. Read the latest market commentary.
Continue reading
HJ Sims is proud to be attending and exhibiting at the 63rd LeadingAge Southeast Annual Convention & Exposition.
Come see us at booth 708!
This morning oil prices slid to a three-month low on news the US and Iran reached an agreement to reopen the Strait of Hormuz. Details of the agreement are still preliminary; but, the Strait of Hormuz is anticipated to reopen following Friday’s signing. The agreement marks the beginning of 60 days of talks regarding Iran’s nuclear program with the potential for continued military attacks if an understanding isn’t reached. However, with oil prices currently around $80-85 per barrel, central bankers are now under less pressure to adjust rates than last week. As a result, Fed rate-hike expectations have shifted further into the future, with Fed Funds Futures not fully pricing in a 25bp move until March 2027. Although the markets are not expecting the Fed to adjust rates at its meeting this week, markets will be closely following Kevin Warsh’s first Fed meeting as “Chairman.”
Treasuries rallied over this past week on anticipation of a deal in Iran and the opening of the Strait of Hormuz. However, munis were little changed with yields only slightly higher from six to 14-years. Investors continue be rewarded for extending out the yield curve with the steepest yields in the 18-21-year maturity range. The slope at the long-end of the municipal yield curve, past 20-years, remains relatively flat with a total slope of 32 bps from 21-30-years. Due to this flat tail, municipal bond investors can currently buy 20-year maturities that yield almost 90% of the 30-year curve versus less than 70% for 10-year maturities.
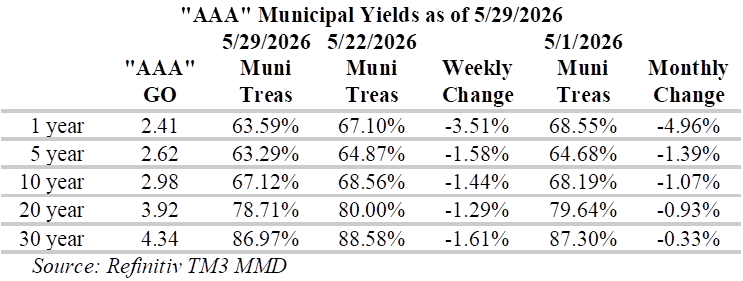
Due to the relative underperformance of munis over the past week, Municipal/Treasury ratios have generally increased over the past week. Looking back a bit, ratios shorter than 10-years, particularly those under one-year, have become dramatically richer over the past month with one-year and shorter ratios now 7.8% lower. Municipal bonds have now fallen well below several important reference points along the curve: ratios for 10-year municipal yields are now well under 70% of Treasuries; 20-year ratios are below 80%; and, 30-year ratios are below 90% of Treasuries. For investors seeking to maximize curve positioning with relative value, the 19 to 21-year part of the municipal yield curve is attractive with slopes of 12 to 13-bps per year and yields around 80% of Treasuries. Although ratios past 20-years are more attractive, relative to Treasuries, the yield curve is very flat over these longer tenors.
Despite the abbreviated holiday week, the Municipal the new issue calendar remains relatively robust this week with US state and local governments expected to sell over $11 billion of bonds. Notable deals include: the State of Washington with $1.52 billion; County of Miami-Dade FL Aviation Revenue has scheduled $637.9 million, New York State Housing Finance Agency is estimated to offer $509.6 million, and the State of Louisiana is expected to bring $375 million to the market. However, technical conditions remain supportive of the primary market. Last week, municipal bond investors added approximately $625 million to municipal-bond funds, according to LSEG Lipper Global Fund Flows. Furthermore, June tax-exempt reinvestment proceeds are expected to reach approximately$54.5 billion.
Herbert J. Sims & Co. Inc. is a SEC registered broker-dealer, a member of FINRA, SIPC. The information contained herein has been prepared based upon publicly available sources believed to be reliable; however, HJ Sims does not warrant its completeness or accuracy and no independent verification has been made as to its accuracy or completeness. The information contained has been prepared and is distributed solely for informational purposes and is not a solicitation or an offer to buy or sell any security or instrument or to participate in any trading or investment strategy, and is subject to change without notice. All investments include risks. Nothing in this message or report constitutes or should be construed to be accounting, tax, investment or legal advice.

HJ Sims is proud to be attending and sponsoring at the ACCS Conference – Repairing the Ruins.
Attending: Stephen Anderson, Vice President

Our team of market analysts have a singular mission: to help you make better investment decisions. Read the latest market commentary.
Continue readingOur team of market analysts have a singular mission: to help you make better investment decisions. Read the latest market commentary.
Continue readingInflation is showing signs of heating-up as the first inflation report under new Federal Reserve chief Kevin Warsh was released last week showing April consumer prices reached their highest level in almost three years. The personal consumption expenditures price index ticked-up to 3.8% for the 12-month period ended in April, almost double the Fed’s 2% target. However, this was not unexpected, as economists surveyed by Dow Jones forecasted a 3.8% rate. In the Treasury Market, inflation expectations have increased anticipation the Fed will hike rates, resulting in the gap between five-year and 30-year yields narrowing to the skinniest levels seen in more than a year. As a result, we have seen short and intermediate Treasuries underperform over the past month. However, fund flows in the muni market remain robust, with investors adding approximately $2.3 billion last week, according to LSEG Lipper Global Fund Flows. As a result, munis have held their ground better than Treasuries over the past month.
Investors continue to be incentivized to extend out the yield curve with the steepest yield slopes in the 18-21-year maturity range and an overall slope of 49 bps. However, slopes at the long-end of the municipal yield curve remain very flat with only 30 bps of slope from 21 to 30 years. Due to this flat tail, municipal bond investors can currently buy 20-year maturities that yield over 90% of the 30-year curve versus less than 70% for 10-year maturities.
Due to the outperformance of munis, Municipal/Treasury ratios have generally declined over the past week. Municipal bonds have continued to price at richer levels as ratios fall well below several important reference points along the curve. Ratios for 10-year municipal yields are now under 70% of Treasuries, 20-year ratios are below 80% and 30-year ratios are below 90% of Treasuries. For investors seeking to maximize curve positioning with relative value, the 19 to 21-year part of the municipal yield curve is attractive with slopes of 11 to 13-bps per year and yields around 80% of Treasuries. Although ratios past 20-years are more attractive, relative to Treasuries, the yield curve is very flat over these longer tenors.
Herbert J. Sims & Co. Inc. is a SEC registered broker-dealer, a member of FINRA, SIPC. The information contained herein has been prepared based upon publicly available sources believed to be reliable; however, HJ Sims does not warrant its completeness or accuracy and no independent verification has been made as to its accuracy or completeness. The information contained has been prepared and is distributed solely for informational purposes and is not a solicitation or an offer to buy or sell any security or instrument or to participate in any trading or investment strategy, and is subject to change without notice. All investments include risks. Nothing in this message or report constitutes or should be construed to be accounting, tax, investment or legal advice.
Our team of market analysts have a singular mission: to help you make better investment decisions. Read the latest market commentary.
Continue readingHJ Sims is proud to be attending, sponsoring, and exhibiting at the National Charter School Conference.
Richard Harmon, Executive Managing Director, Head of Education Banking
Akshai Patel, Executive Vice President
John Solarczyk, Executive Vice President
Christy Meinzer, Director of Marketing, Banking and Firmwide Initiatives
Staci Webb, Senior Administrative and Operational Associate
Come visit us at booth 619 on the EXPO floor.


