

Our team of market analysts have a singular mission: to help you make better investment decisions. Read the latest market commentary.
Continue readingOur team of market analysts have a singular mission: to help you make better investment decisions. Read the latest market commentary.
Continue readingHJ Sims is proud to be attending, sponsoring, and exhibiting at the National Charter School Conference.
Richard Harmon, Executive Managing Director, Head of Education Banking
Akshai Patel, Executive Vice President
John Solarczyk, Executive Vice President
Christy Meinzer, Director of Marketing, Banking and Firmwide Initiatives
Staci Webb, Senior Administrative and Operational Associate
Come visit us at booth 619 on the EXPO floor.
HJ Sims is proud to be attending the ASHA Mid-Year Meeting.

HJ Sims is proud to be attending and exhibiting at the LeadingAge Massachusetts Annual Conference & EXPO.
Come visit us on the EXPO floor. Booth number will be forthcoming.
Attendees: Andrew Nesi, Executive Vice President
HJ Sims is proud to be attending the LeadingAge Virginia Annual Conference and EXPO.
Attending: Tom Bowden, Senior Vice President, David Saustad, Vice President, Steven Hicks, Vice President
Our team of market analysts have a singular mission: to help you make better investment decisions. Read the latest market commentary.
Continue readingLast week, there was a global selloff in government bonds as markets recalibrated inflation risk amid surging energy prices and speculation that central banks will tighten monetary policy. The Bureau of Labor Statistics (BLS) released its CPI report last Tuesday, which indicated that prices rose 0.6% from March and 3.8% from a year earlier. This is the highest annual reading since May 2023 and significantly above the 0.3% and 2.7% that economists had forecast. To compound matters, on Wednesday, the BLS released its Producer Price Index which showed prices climbing 6% year-over-year in April. The resulting selloff was propelled by climbing crude oil prices and a US-Chinese summit that delivered only modest results and no breakthroughs on the war in Iran. Not surprisingly, the sentiment in the Fed funds futures market has fluctuated dramatically over the past month from the Fed cutting rates to the Fed now hiking rates as soon as next March.
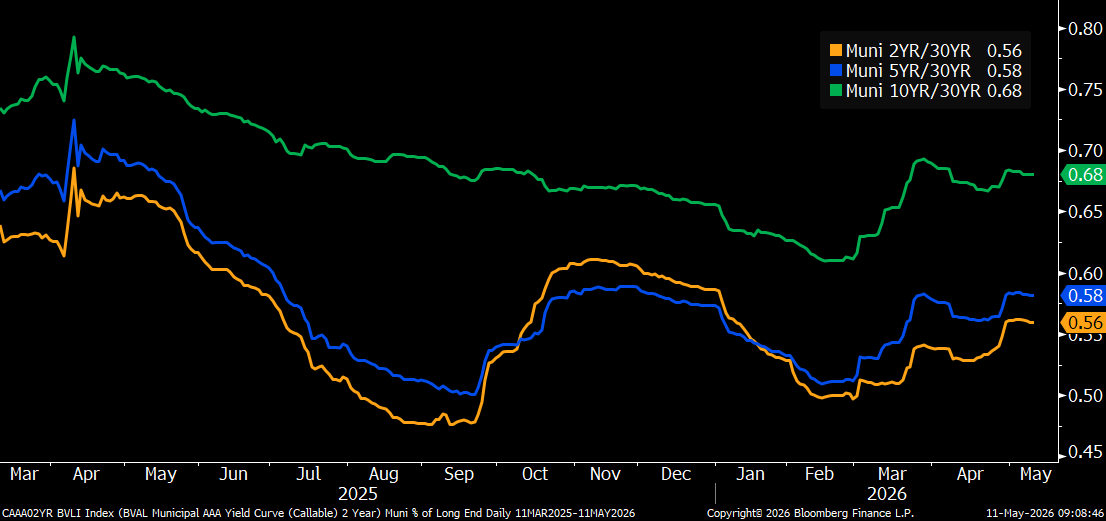
The selloff over this past week included both munis and Treasuries with Treasuries little changed for tenors under 2-years and 18-20 bps higher from five to ten years declining to 15 bps higher at 30-years. Munis generally lagged behind Treasuries with a more uniform parallel shift upward by about ten bps across the yield curve. Despite these developments, investors continue to be rewarded for extending out the yield curve with the steepest yields in the 18-21-year maturity range. The slope at the long-end of the municipal yield curve has increased past 20-years, but remains relatively flat with a total slope of 32 bps from 21-30-years. Due to this flat tail, municipal bond investors can currently buy 20-year maturities that yield over 90% of the 30-year curve versus less than 70% for 10-year maturities.
Although municipal/Treasury ratios generally declined over the past week, the short-end of the yield curve actually increased due to the muted response from Treasuries in this part of the curve. Municipal bond ratios have now fallen just below several important reference points along the curve. Ratios for 10-year municipal yields are under 70% of Treasuries, 20-year ratios are below 80% and 30-year ratios are below 90% of Treasuries. For investors seeking to maximize curve positioning with relative value, the 19 to 21-year part of the municipal yield curve is attractive with slopes of 12 to 13-bps per year and yields around 80% of Treasuries. Although ratios past 20-years are more attractive, relative to Treasuries, the yield curve is very flat over these longer tenors and investors are not being appropriately compensated to take the additional risk.
The municipal new issue calendar continues to be heavy this week with US state and local governments expected to sell over $11 billion of bonds. Notable deals include: the School District of Philadelphia, which plans to sell $797.5 million; Great Lakes Water Authority Water Supply System Revenue is expected to sell $754 million; Missouri Highway & Transportation Commission is on the calendar with $609 million; and, Massachusetts Educational Financing Authority is expected to bring $388.4 million to market. Despite record issuance this year, technical conditions remain supportive of the primary market. Last week, municipal bond investors added approximately $1.3 billion to municipal-bond funds, according to LSEG Lipper Global Fund Flows. Furthermore, May tax-exempt reinvestment proceeds are expected to reach approximately $34.5 billion.
Herbert J. Sims & Co. Inc. is a SEC registered broker-dealer, a member of FINRA, SIPC. The information contained herein has been prepared based upon publicly available sources believed to be reliable; however, HJ Sims does not warrant its completeness or accuracy and no independent verification has been made as to its accuracy or completeness. The information contained has been prepared and is distributed solely for informational purposes and is not a solicitation or an offer to buy or sell any security or instrument or to participate in any trading or investment strategy, and is subject to change without notice. All investments include risks. Nothing in this message or report constitutes or should be construed to be accounting, tax, investment or legal advice.
Our team of market analysts have a singular mission: to help you make better investment decisions. Read the latest market commentary.
Continue reading
HJ Sims is proud to be attending and exhibiting at the LeadingAge Connecticut and Rhode Island Conference & Tradeshow.
Come Visit us at booth 44 on the EXPO floor.
Attendees: Andrew Nesi, Executive Vice President

HJ Sims is proud to be attending and speaking at the LeadingAge California BOLD Annual Conference and Expo.
Session Date & Time: May 20, 4:30pm
Session Description: Defining Mid-Market Communities
Featured Speaker:
The Bureau of Labor Statistics released its Employment Situation report last Friday which reported nonfarm payroll increased by 115,000 jobs in April, despite rising energy costs from the Iran war. This is significant as the markets contemplate the future rate path of the Fed and its dual mandate to promote both maximum employment and stable prices. Collectively, the job gains in March and April mark the strongest two-month increase since 2024. Recent employment data gives the Fed justification to maintain interest rates at current levels, for the foreseeable future, while they focus on inflationary risks from rising energy prices.
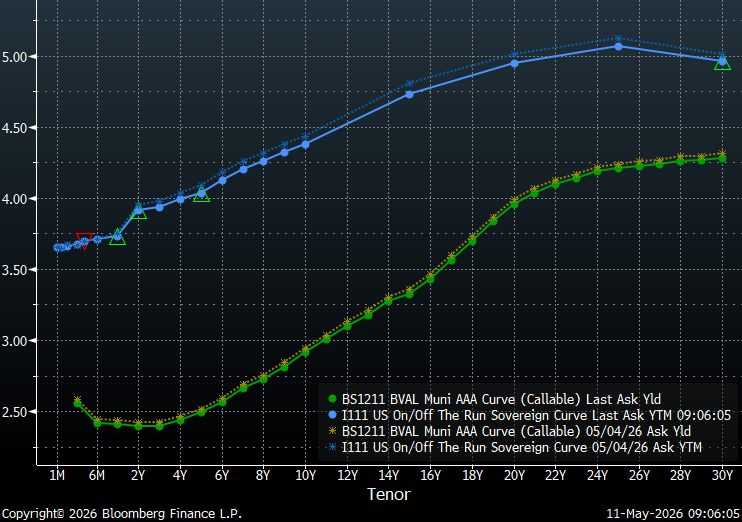
Over the past week, both munis and Treasuries advanced with a modest decrease of four and a half to seven and a half basis points in Treasury yields for all but the shortest maturities. Munis lagged with a more uniform response over the week with a parallel shift downward of about three basis points. The biggest changes in Treasuries occurred in the 15 to 20-year tenor where rates fell by about seven basis points. Despite these developments, investors continue be rewarded for extending out the yield curve with the steepest yields in the 18-21-year maturity range. The muni yield curve has generally flattened over the past 3-months with short yields rising faster than longer maturities as the narrative for rate cuts and inflation has shifted. As a result, the percentage of yields relative to the 30-year curve has increased for shorter maturities. The long-end of the yield curve remains increasingly flat past 20-years, with a total slope of 26 bps from 21-30-years. Due to this flat tail, municipal bond investors can currently buy 20-year maturities that yield over 90% of the 30-year curve versus less than 70% for 10-year maturities.
Municipal/Treasury ratios have generally declined over the past week as the short-end of the yield curve declined more than the long-end. Municipal bonds have fallen just below several important reference points along the curve. Ratios for 10-year municipal yields are under 70% of Treasuries, 20-year ratios are below 80% and 30-year ratios are below 90% of Treasuries. For investors seeking to maximize curve positioning with relative value, the 18 to 21-year part of the municipal yield curve is attractive with slopes of 12 to 13-bps per year and yields approaching 80% of Treasuries. Although ratios past 20-years are more attractively priced, relative to Treasuries, the yield curve is very flat over these longer tenors.

The Municipal new issue calendar picks-up again this week as US state and local governments are expected to sell over $13 billion of bonds. Notable deals include: the State of Connecticut, which plans to sell $1.12 billion of bonds; the City of Atlanta Water & Wastewater Revenue has scheduled $1.1 billion; the City of Boston is expected to offer $609.3 million; and, Trustees of Columbia University in the City of New York is scheduled to bring $486.9 million to the market. Despite record issuance this year, technical conditions remain supportive of the primary market. Last week, municipal bond investors added approximately $1.8 billion to municipal-bond funds, according to LSEG Lipper Global Fund Flows. Furthermore, May tax-exempt reinvestment proceeds are expected to reach approximately $34.5 billion.
Herbert J. Sims & Co. Inc. is a SEC registered broker-dealer, a member of FINRA, SIPC. The information contained herein has been prepared based upon publicly available sources believed to be reliable; however, HJ Sims does not warrant its completeness or accuracy and no independent verification has been made as to its accuracy or completeness. The information contained has been prepared and is distributed solely for informational purposes and is not a solicitation or an offer to buy or sell any security or instrument or to participate in any trading or investment strategy, and is subject to change without notice. All investments include risks. Nothing in this message or report constitutes or should be construed to be accounting, tax, investment or legal advice.
Our team of market analysts have a singular mission: to help you make better investment decisions. Read the latest market commentary.
Continue readingWe look forward to connecting at the LeadingAge Maryland Conference & Exposition.
Aaron Rulnick, Managing Principal, Head of Investment Banking will be speaking on the topic below:
May 19, 9:30am
Effective Governance as a Catalyst for Strategic Growth
Attendance:
HJ Sims is proud to be attending the LeadingAge Missouri Annual Conference & Exposition.
Attending: Nick Roberts, Senior Vice President
We look forward to connecting at the LeadingAge New York Spring Leadership Conference and Exposition.
Visit HJ Sims at booth #40 on the EXPO Floor, and start a conversation.
Attending:
HJ Sims is proud to be attending and exhibiting at the LeadingAge Texas Annual Conference & Solutions Exposition.
Attending:
Jimmy Rester, Executive Vice President
Nick Roberts, Senior Vice President
Come visit us at booth 331.
Last week the Fed voted to leave its policy rate unchanged at 3-1/2 to 3-3/4 percent citing developments in the Middle East as contributing to heightened uncertainty in their economic outlook. Although this was the Powell’s final meeting serving as Fed chair, he has announced his intentions to remain on the Fed’s board after his term as chair ends. Powell could potentially remain in place as a governor until that term ends in 2028. The Fed does not meet again until June 16-17, when Kevin Warsh will host his first meeting as the new chair.
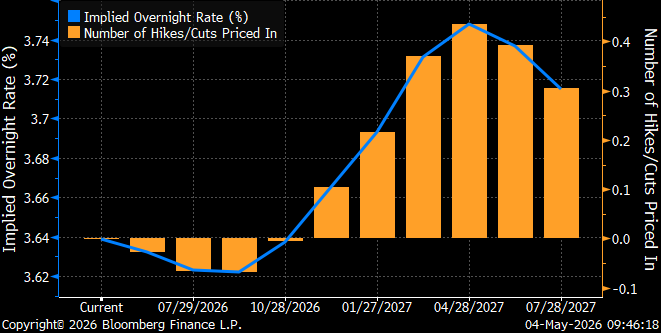
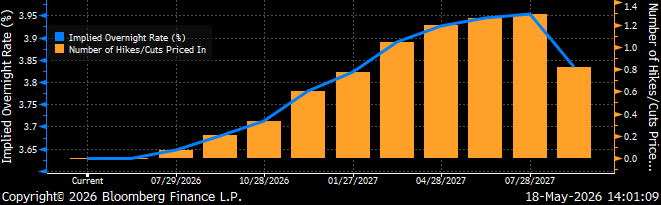
It is notable that as the market transitions from Powell to Warsh, the outlook has shifted. At last week’s meeting, four Fed officials voted against the board’s decision with objections over language suggesting the central bank would eventually resume cutting rates. Rising oil prices and a lack of progress in talks between the US and Iran has markets concerned that rates will remain higher for longer. With the Fed’s dual mandate to promote maximum employment and stable prices, the markets are concerned that policymakers will focus on oil fueled inflation rather than employment. Although the Fed funds futures market is currently anticipating that rates remain unchanged for the next 12-months, the outlook has shifted from cuts to hikes.
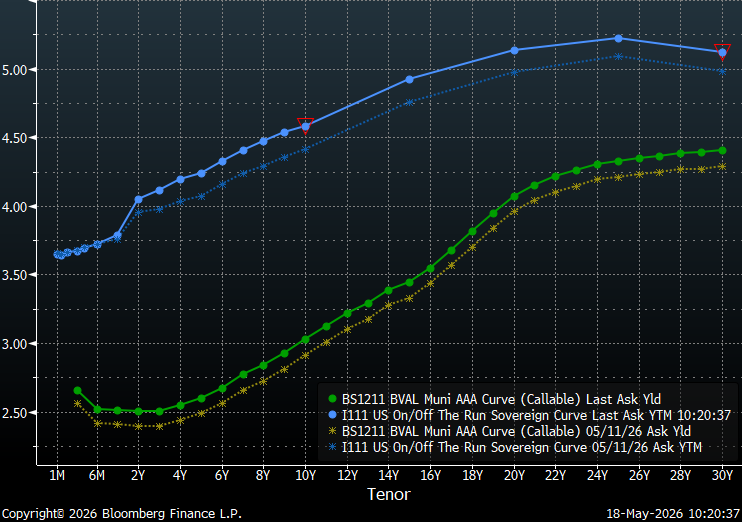
Over the past week, munis and Treasuries have both sold-off with rates rising anywhere from five to 13-basis points for all but the shortest maturities. The biggest changes have occurred around the policy sensitive two-to-three-year tenors while yields have risen about 5 bps for maturities past 14-years. Despite these developments, investors continue be rewarded for extending out the yield curve with the steepest yields in the 18-21-year maturity range. The long-end of the yield curve remains increasingly flat past 20-years, with a total slope of 26 bps from 21-30-years. Due to this flat tail, municipal bond investors can currently buy maturities around 20-years that yield over 90% of the 30-year curve.
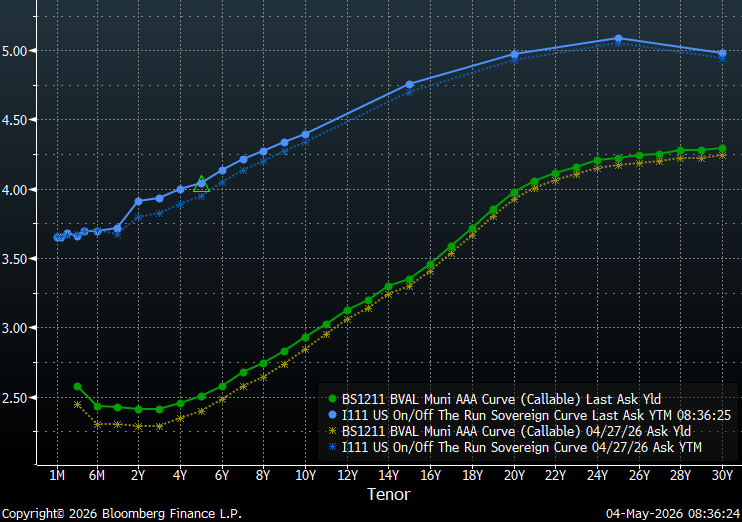
As a result of the prolific short maturity bid-wanted activity, municipal/Treasury ratios for one-year and shorter maturities are meaningfully higher than they were last week with ratios over 3% higher/cheaper. Past five years, ratios slip a bit higher with demand extending out the curve to the longer maturities where relative yields are more appealing. However, municipal bonds have fallen just below several important reference points along the curve. Ratios for 10-year municipal yields remain under 70% of Treasuries, 20-year ratios are below 80% and 30-year ratios are below 90% of Treasuries. For investors seeking to maximize curve positioning with relative value, the 18 to 21-year part of the municipal yield curve has become tempting with slopes of 12 to 13-bps per year. Although ratios past 20-years remain attractively priced relative to Treasuries, the yield curve is very flat and does not reward extension over these longer tenors.

The Municipal new issue calendar picks-up a bit this week as US state and local governments are expected to sell over $12 billion of bonds. Notable deals include: the City of Chicago Waterworks Revenue Bonds with $824.7 million, Texas State University System has scheduled $762.2 million, Chabot-Las Positas Community College District is expected to offer $531 million, and Indiana Municipal Power Agency is anticipated to bring $430 million to the market. Despite record issuance this year, technical conditions remain supportive of the primary market. Last week, municipal bond investors added approximately $615 million to municipal-bond funds, according to LSEG Lipper Global Fund Flows. Furthermore, May tax-exempt reinvestment proceeds are expected to reach approximately $34.5 billion.
Herbert J. Sims & Co. Inc. is a SEC registered broker-dealer, a member of FINRA, SIPC. The information contained herein has been prepared based upon publicly available sources believed to be reliable; however, HJ Sims does not warrant its completeness or accuracy and no independent verification has been made as to its accuracy or completeness. The information contained has been prepared and is distributed solely for informational purposes and is not a solicitation or an offer to buy or sell any security or instrument or to participate in any trading or investment strategy, and is subject to change without notice. All investments include risks. Nothing in this message or report constitutes or should be construed to be accounting, tax, investment or legal advice.