

Our team of market analysts have a singular mission: to help you make better investment decisions. Read the latest market commentary.
Continue readingOur team of market analysts have a singular mission: to help you make better investment decisions. Read the latest market commentary.
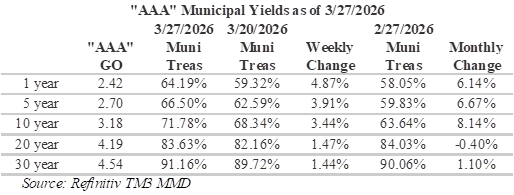
Continue readingThe capital markets continue to focus on developments in the Middle East, amid heightened uncertainty, as the April 7 deadline for massive strikes on Iranian energy infrastructure looms. Daily volatility remains high as the market vacillates back and forth from anticipating a relatively short end to the war to threats of intensive and prolonged attacks. The bond market ended last week with Treasury yields jumping three to four basis points across maturities on Friday, following significantly stronger-than-expected March payrolls data. The unemployment rate ticked lower from 4.4% to 4.3%, which helped dispel anxieties of a softening labor market.

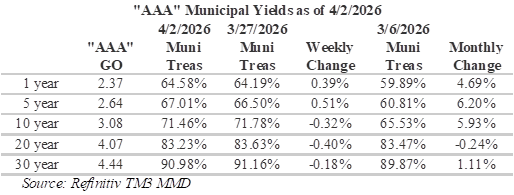
Over the past month, the Bloomberg US Municipal Bond Index (LMBITR) dropped 2.32% through March 31, which is the biggest monthly decline since September 2023. As a result, year-to-date gains were essentially erased with the LMBITR index declining 0.18% through the end of the first quarter. Generally speaking, high yield munis and shorter maturities were the better performing bond sectors with high yield tobacco bonds returning 1.47% and the one to two-year maturity bucket returning 0.64%. By comparison the Treasury market was less impacted as demonstrated by only a 1.67% drop in the Treasury index through the end of the quarter.
Over the past month, the biggest moves in Treasury yields have been around the 2 to 5 year portion of the yield curve with yields now about 50bps higher than a month ago. For munis, the biggest moves in yields have been around the 6 to 13-year year portion of the yield curve where yields are now around 50bps higher than they were a month ago. In addition, bond traders are currently betting the Federal Reserve will keep interest rates steady this year, on signs of a stabilizing US labor market and uncertainty about the economic impact of war in the Middle East.
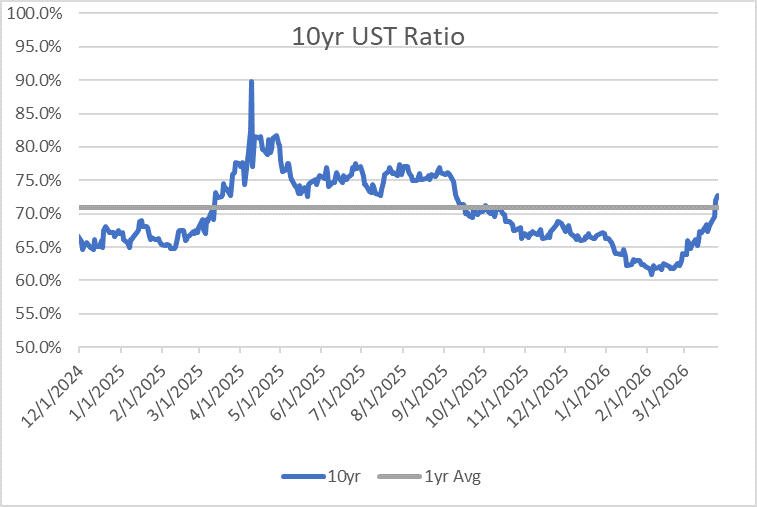
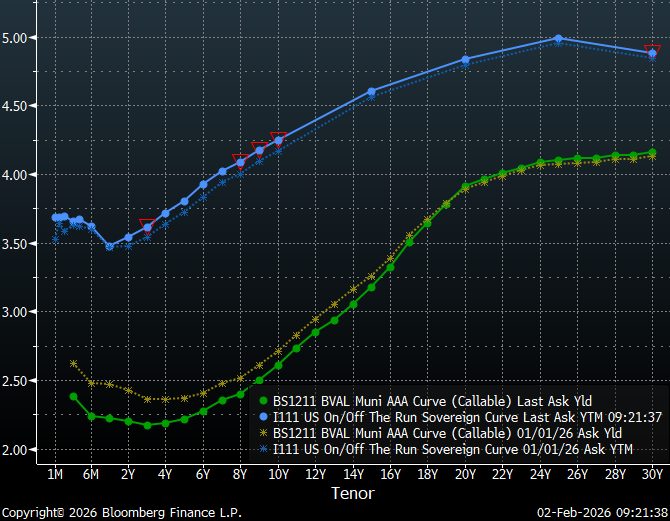
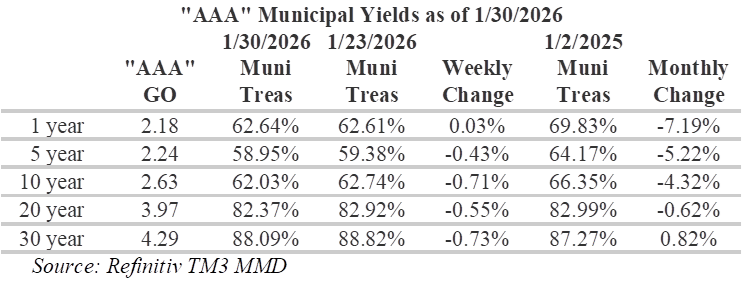
Municipal/Treasury ratios have increasingly become more appealing around the 10-year tenor with ratios now over 70%. As a result, this has become a significantly more appealing portion of the curve to position with ratios declining slightly over the past week. Muni/Treasury ratios for maturities shorter than 1-year are now yielding almost 65% of Treasuries, while 30-year munis continue to yield over 90% of equivalent Treasuries. Although ratios past 20-years are attractively priced relative to Treasuries, the yield curve remains very flat over these longer tenors. Due to the flat tail, municipal bond investors can currently buy maturities under 20-years that yield almost 90% of the 30-year curve.
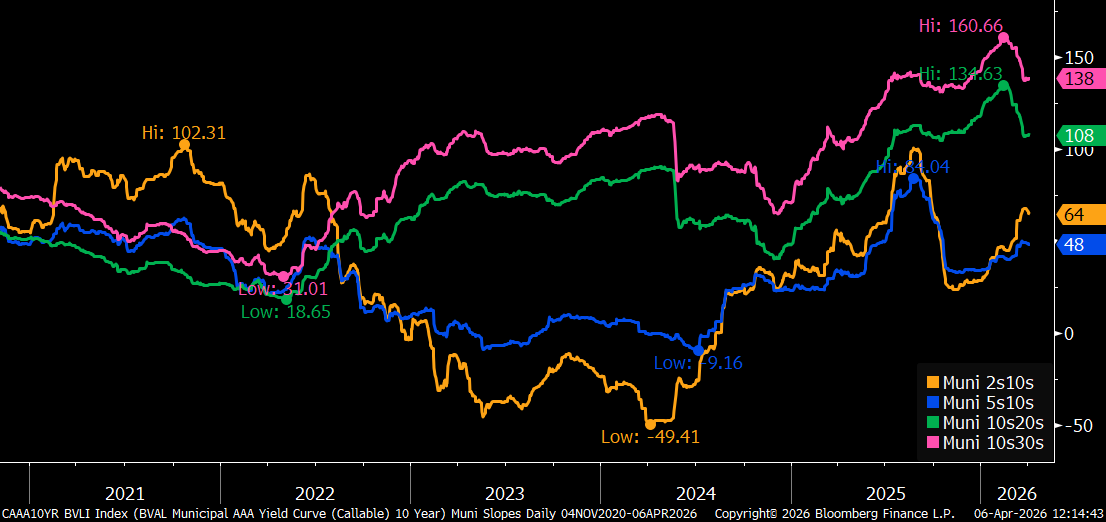
Despite shifting muni/Treasury ratios, slopes along the municipal yield curve continue to reward extending duration. Investors are rewarded for extending out the yield curve with appealingly steep yields with 2s10s (the yield differential between 2-year and 10-year munis) now around 64 bps, which is over double the spread at the start of the year. However, 10s20s and 10s30s have both compressed from their mid-February highs, indicating flattening in these portions of the yield curve. Overall, the yield curve remains steepest around both the 10-year and 20-year maturities. As discussed above, the yield curve becomes increasingly flat past 20-years, with a total slope of 37 bps from 20-30-years. For investors seeking to maximize curve positioning with relative value, the 18 to 21-year part of the municipal yield curve has become very tempting with slopes of 12 to 13-bps per year yields approaching 85% of Treasuries.
This week, US state and local governments are expected to sell more than $9.8 billion of bonds. Notable deals include: Vanderbilt University Medical Center Obligated Group, which plans to sell $1.26 billion of bonds; City of Austin TX Airport System Revenue, which is scheduled to sell $1.18 billion; and, State of California is on the calendar with a $740.4 million issue. HJ Sims will also be in the market with Explore Academy Albuquerque, which is expected to include $49.73 million in tax-exempt bonds and $1.8 million in taxable bonds. This week, markets will be closely following durable goods orders for February on Tuesday, followed by the third estimate of fourth-quarter gross domestic product and PCE inflation data for February on Thursday. Markets will also be parsing the minutes from the March Federal Reserve meeting for clues on the Fed’s future rate path, which are scheduled to be released on Wednesday.
Herbert J. Sims & Co. Inc. is a SEC registered broker-dealer, a member of FINRA, SIPC. The information contained herein has been prepared based upon publicly available sources believed to be reliable; however, HJ Sims does not warrant its completeness or accuracy and no independent verification has been made as to its accuracy or completeness. The information contained has been prepared and is distributed solely for informational purposes and is not a solicitation or an offer to buy or sell any security or instrument or to participate in any trading or investment strategy, and is subject to change without notice. All investments include risks. Nothing in this message or report constitutes or should be construed to be accounting, tax, investment or legal advice.
This morning we were welcomed by green screens as Treasuries advanced following weeks of selling. Nevertheless, Day-to-day volatility remains high in the fixed income markets with the war in the Middle East continuing to dominate headlines and what the media is referring to as the biggest oil supply shock in history. The war is now in its second month and the rate cuts investors have been anticipating over the past year are appearing increasingly less likely. Not surprisingly, pricing in the Fed funds futures market has fluctuated dramatically over this past week with current pricing indicating only the chance of a cut over the next year.
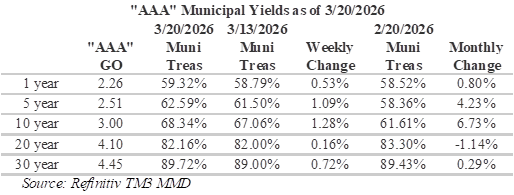
Treasuries have generally performed better than munis over the past week, leaving the Treasury yield curve essentially unchanged while munis are roughly 10 to 16 bps higher, depending upon the maturity. The intermediate portion of the muni curve experienced the biggest moves, with maturities from four to 11-years now as much as 16 bps higher. On the trade desk we have previously noted that new issue supply and a lack of inquiry have lead to weakness around the 10-year maturity while trading has become relaxed on the short-end with muni/Treasury ratios loosening up. As a result, municipal/Treasury ratios have increasingly become more appealing around the 10-year tenor with ratios now over 70%. As a result, this has become a significantly more appealing portion of the curve to position.
Despite shifting muni/Treasury ratios, slopes along the municipal yield curve continue to reward extending duration. Investors are encouraged to extend out the yield curve with appealingly steep yields in the four to 12-year range, with an overall slope of 87 bps. Furthermore, the steepest slopes along the yield curve are currently around the 17- 20-year maturities with approximately 12-bps per year of additional yield for extending in this range. However, the yield curve becomes very flat past 20-years, with a total slope of 24 bps from 20-30-years.
Ratios for muni maturities shorter than 1-year are yielding almost 65% of Treasuries while 30-year munis are now yielding over 90% of equivalent Treasuries. Although ratios past 20-years are attractively priced relative to Treasuries, the yield curve remains very flat over these longer tenors. Due to the flat tail, municipal bond investors can currently buy maturities under 20-years that yield almost 90% of the 30-year curve. For investors seeking to maximize curve positioning with relative value, the 17 to 20-year part of the municipal yield curve has become very tempting with a combination of steep slopes and attractive relative yields.
This week, a combination of a more modest new issue calendar and $19.7 billion in maturing principal and interest coming due on April 1, should conspire to create a more favorable environment for munis. Notable deals include: Black Belt Energy Gas District, which plans to sell $1 billion; East Bay municipal Utility District is scheduled to sell $694.3 million, and the Michigan State Housing Development Authority is expected to sell $568 million. According to LSEG Lipper Global Fund Flows, investors pulled roughly $600 million from municipal bond funds last week. Long-term funds reportedly saw outflows of $905 million and high-yield funds saw outflows of $606 million while intermediate-maturity funds received $193 million. Considering recent developments in muni/Treasury ratios, it should come as no surprise that the majority of inflows are going to intermediate funds.
Herbert J. Sims & Co. Inc. is a SEC registered broker-dealer, a member of FINRA, SIPC. The information contained herein has been prepared based upon publicly available sources believed to be reliable; however, HJ Sims does not warrant its completeness or accuracy and no independent verification has been made as to its accuracy or completeness. The information contained has been prepared and is distributed solely for informational purposes and is not a solicitation or an offer to buy or sell any security or instrument or to participate in any trading or investment strategy, and is subject to change without notice. All investments include risks. Nothing in this message or report constitutes or should be construed to be accounting, tax, investment or legal advice.
Our team of market analysts have a singular mission: to help you make better investment decisions. Read the latest market commentary.
Continue readingDay-to-day volatility remains high in the fixed income markets with the war in the Middle East continuing to dominate headlines. At the Fed’s meeting last week, the Committee decided to maintain the target range for the federal funds rate at 3-1/2 to 3-3/4 percent. The Fed Chair expressed a cautious outlook, noting that current inflation levels are being driven by factors pre-dating the conflict in Iran and estimating that between half and three-quarters of total core inflation is actually tariffs. In addition, the Chair commented that typically the Fed looks through energy shocks and expects to see inflation improving around the middle of this year. The current uncertainty has resulted in a choppy Fed funds futures market with current pricing not indicating any rate cuts over the next 12-months.
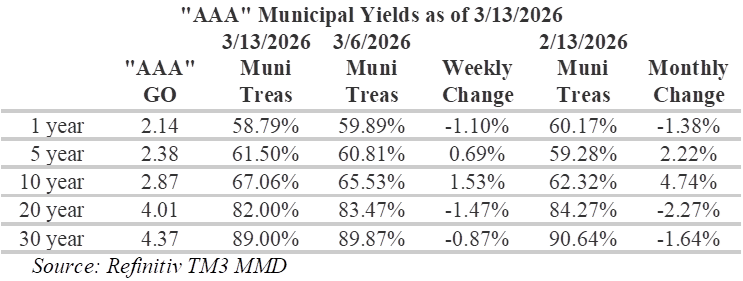
Over the past week, both munis and Treasuries have generally sold-off with Treasuries outperforming as munis catch-up. Since the outbreak of the war in the Middle East, munis and Treasuries have sold-off by roughly 30 to 40 bps for maturities longer than 20-years. The largest moves in Treasuries have not been around the policy sensitive 2-4 year maturities, where Treasuries have sold-off roughly 45 bps. However, municipals have experienced their biggest moves around the 8 to 14-year maturities where they have sold-off by close to 50 bps from February 28, at the beginning of the war with Iran.
On the trade desk we have noted that a combination of new issue supply and a lack of inquiry has lead to weakness around the 10-year maturity, while trading has become relaxed on the short-end with muni/Treasury ratios loosening up. As a result, municipal/Treasury ratios have increasingly become more appealing in the 5 to 10-year tenors with ratios now approaching 70% and making this a significantly more appealing portion of the curve to position. Despite shifting muni/Treasury ratios, slopes along the municipal yield curve continue to reward extending duration. Investors are currently incented to move out the yield curve with steepening yields around the 11-20 year range, with an overall slope of 109 bps. However, the yield curve becomes very flat past 20-years, with a total slope of only 24 bps for 20-30-years. Currently, the steepest slopes on the municipal curve are available from 17 to 21-years where investors can pick-up approximately 60 bps.
Although municipal ratios past 20-years remain attractive relative to Treasuries, the yield curve remains very flat over these longer tenors. Due to the flat tail that has formed at the end of the municipal yield curve, investors can currently buy maturities under 20-years that yield almost 90% of the 30-year curve. For investors seeking to maximize curve positioning with relative value, the 17 to 20-year part of the municipal yield curve offers progressively improving opportunities with slopes of 12 to 13-bps per year.
The new issue municipal calendar picks-up this week and is expected to include $15.9 billion of new issues. Notable deals include: the City of New York, which plans to sell $2.58 billion; the State of Illinois is scheduled to sell $1.4 billion, and the UPMC Obligated Group is expected to sell $1.2 billion. According to LSEG Lipper Global Fund Flows, investors added roughly $1.8 billion to municipal bond funds last week. Long-term funds reportedly received $1.5 billion and high-yield funds added about $651 million. Considering current muni/Treasury ratios, it is not surprising that the majority of inflows are going to intermediate and long-term muni funds.
Herbert J. Sims & Co. Inc. is a SEC registered broker-dealer, a member of FINRA, SIPC. The information contained herein has been prepared based upon publicly available sources believed to be reliable; however, HJ Sims does not warrant its completeness or accuracy and no independent verification has been made as to its accuracy or completeness. The information contained has been prepared and is distributed solely for informational purposes and is not a solicitation or an offer to buy or sell any security or instrument or to participate in any trading or investment strategy, and is subject to change without notice. All investments include risks. Nothing in this message or report constitutes or should be construed to be accounting, tax, investment or legal advice.
Our team of market analysts have a singular mission: to help you make better investment decisions. Read the latest market commentary.
Continue readingThe war in the Middle East continues to dominate headlines, leading to a high degree of volatility in oil prices and pressuring the stock and the bond markets alike. The Fed funds futures market is currently indicating the Fed will not adjust the overnight lending rate at its meeting later this week. Due to the high degree of uncertainty from the war in the Middle East, this is not surprising. Furthermore, current pricing anticipates the Fed will hold rates steady until January of next year.
Bond investors are currently asking for more compensation for the risk of holding long-dated Treasuries. Over the past week, Treasury yields have increased by approximately 16 bps for the 30-year maturity while the extreme short-end, around 1-month, remains virtually unchanged. Munis have responded similarly, although to a lesser degree, with rates roughly 9 bps higher on the long-end. However, the largest moves in the municipal scale were in the intermediate maturities from 8 to 12-years. As a result, municipal/Treasury ratios have become more appealing in the in the 5 and 10-year tenors with ratios on the long-end and short-end becoming more rich, characterized by lower relative yields. Currently, ratios for maturities shorter than 1-year are back in the 50’s while 30-year munis are now yielding less than 90% of equivalent Treasuries.
Despite shifting muni/Treasury ratios, slopes along the municipal yield curve continue to reward extending duration. Investors are currently incentivized to move out the yield curve with appealingly steep yields in the 10-20 year range, with a slope of 102 bps, versus only 74 bps from 1-10 years. Currently, the steepest slopes on the municipal curve are available from 16 to 20-years where investors can pick-up approximately 51 bps. However, caution is advised for tenors past 20-years, where there is only 25 bps to be gained by extending out to 30-years. It is also notable that although municipal curve slopes remain appealingly steep, they have moderated in certain portions of the curve over the past week.
Although ratios have compressed on the long-end, due to the flat tail, municipal bond investors can currently buy maturities under 20-years that yield almost 90% of the 30-year curve. With muni/Treasury ratios for 10-year maturities, although improved, still quite rich at around 65%. While the yield curve remains very flat over these longer tenors, ratios past 20-years remain attractive relative to Treasuries. For investors seeking to maximize curve positioning with relative value, the 17 to 20-year part of the municipal yield curve has become very tempting with slopes of 12 to 14-bps per year.
The new issue municipal calendar is a bit lighter this week and is expected to bring $8.27 billion of new issues. Notable deals include: Black Belt Energy Gas District, which plans to sell $1.23 billion; New York City Water & Sewer System is scheduled to sell $983.1 million, and Cleveland Clinic Health System Obligated Group is expected to sell $530.8 million. According to LSEG Lipper Global Fund Flows, investors added roughly $216 million to long-term municipal bond funds and $280 million to intermediate maturity funds. Considering current muni/Treasury ratios, it is not surprising that the majority of inflows are going to intermediate and long-term muni funds.
Herbert J. Sims & Co. Inc. is a SEC registered broker-dealer, a member of FINRA, SIPC. The information contained herein has been prepared based upon publicly available sources believed to be reliable; however, HJ Sims does not warrant its completeness or accuracy and no independent verification has been made as to its accuracy or completeness. The information contained has been prepared and is distributed solely for informational purposes and is not a solicitation or an offer to buy or sell any security or instrument or to participate in any trading or investment strategy, and is subject to change without notice. All investments include risks. Nothing in this message or report constitutes or should be construed to be accounting, tax, investment or legal advice.
The war in the Middle East continues to draw the markets focus as bond traders attempt to manage inventory exposure with oil prices now through $100 per barrel. Last week’s softening labor market data from the Bureau of Labor Statistics and skyrocketing oil prices have fixed income markets nervous that energy costs could trigger a surge in inflation while constricting economic growth. Not surprisingly, Fed Funds Futures are now implying only one rate cut over the next 12-months and another cut 12-months later.

Although the long-end of both the municipal and Treasury yield curves has experienced increases of similar magnitude over the past week, tenors less than 1-year have performed remarkably different. While six-month Treasury yields are virtually unchanged from last week, munis in this range increased by 10bps. The impact of this difference is a treasury curve that is steepening and a muni curve that is shifting upward in a more parallel fashion. The result contradicts recent trends, with muni/Treasury ratios for periods 10-years and less have becoming more attractive over the past week while longer tenors become slightly less favorable. Currently, ratios for maturities shorter than 1-year are yielding almost 60% of their Treasury equivalents while 30-year munis are yielding just under 90% of equivalent Treasuries.
Despite shifting muni/Treasury ratios, slopes along the municipal yield curve continue to reward extending duration. Investors are currently incented to move out the yield curve with appealingly steep yields in the 10-20 year range, with a slope of 124 bps, versus only 58 bps from 1-10 years. Currently, the steepest slopes on the municipal curve are available from 15 to 20-years where investors can pick-up approximately 69 bps. However, caution is advised for tenors past 20-years, where there is only 32 bps to be gained by extending all the way out to 30-years. It is also notable that although municipal curve slopes remain appealingly steep, they have also moderated in certain portions of the curve over the past week.
Nevertheless, by positioning in the longer intermediate portion of the curve, investors benefit from a steep roll-down over time. Furthermore, due to flat long-term rates, municipal bond investors can currently buy maturities under 20-years that yield almost 90% of the 30-year curve. With muni/Treasury ratios for 10-year and shorter maturities, although improved, still quite rich at under 60%. extending maturities further out the curve have the added benefit of more appealing relative yields. Ratios in 20-year and longer maturities remain attractive, relative to Treasuries, due to seasonal activity and wider spreads. However, the yield curve remains very flat over these longer tenors. For investors seeking to maximize curve positioning with relative value, the 17 to 20-year part of the municipal yield curve has become very tempting with slopes of 15 to 16-bps per year.
This week’s deal municipal bond deal calendar anticipates another week of strong issuance with an estimated $13.5 billion of new issues. Notable issues include: the Dormitory Authority of the State of New York, which plans to sell $2.575 billion; the State of California is scheduled to sell $2.387 billion in general obligation bonds, and California Community Choice is expected to sell $904.945 million in clean energy project revenue bonds. Due to current events, it is possible the status of current deals may change as conditions evolve. Despite 15 consecutive weeks of inflows and approximately $1.4 billion being added to municipal bond funds last week, according to LSEG Lipper Global Fund Flows, investors may be reluctant to commit capital due to international events. Considering current muni/Treasury ratios, it is not surprising that the majority of inflows are going to intermediate and long-term muni funds.
Herbert J. Sims & Co. Inc. is a SEC registered broker-dealer, a member of FINRA, SIPC. The information contained herein has been prepared based upon publicly available sources believed to be reliable; however, HJ Sims does not warrant its completeness or accuracy and no independent verification has been made as to its accuracy or completeness. The information contained has been prepared and is distributed solely for informational purposes and is not a solicitation or an offer to buy or sell any security or instrument or to participate in any trading or investment strategy, and is subject to change without notice. All investments include risks. Nothing in this message or report constitutes or should be construed to be accounting, tax, investment or legal advice.
Our team of market analysts have a singular mission: to help you make better investment decisions. Read the latest market commentary.
Continue readingThis morning, Treasury bonds sold-off amid surging oil prices as inflation fears drove yields higher. As conflict in the Middle East escalates, disruption in tanker activity and supply concerns will remain in-focus. Typically global conflict will place downward pressure on rates as investors seek safety; however, in a market already sensitive to inflation and the potential for further rate cuts oil driven inflation concerns have unsettled investors.
Trading in munis has been muted today, with investors cautiously waiting for additional information. Over the past month munis have generally lagged the rally in Treasuries, particularly for tenors past 2-years. The result has been a Treasury curve that has flattened about 18 bps while the muni curve steepened by about 6 bps. Recent activity is the continuation of a long-term trend in muni/Treasury ratios with ratios at the extreme short-end becoming more rich (less appealing) and ratios on the long-end becoming cheaper (more appealing). Currently, ratios for maturities shorter than 1-year are yielding 58.5% of their Treasury equivalents while 30-year munis are yielding over 90% of equivalent Treasuries.
Slopes along the municipal yield curve continue to reward extending duration. Investors are incented to move longer out the yield curve by appealingly steep yields in the 10-20 year range, with a slope of 132 bps, versus only 50 bps from 1-10 years. Currently, the steepest slopes on the municipal curve are available from 15 to 20-years, where investors can pick-up approximately 74 bps. However, caution is advised for tenors past 20-years, where there is only 33 bps to be gained by extending out the remaining 10-years.
Investors positioning in the longer intermediate portion of the curve benefit from a steep roll-down over time. In addition, due to flat long-term rates, municipal bond investors can currently buy maturities under 20-years that yield almost 90% of the 30-year curve. With muni/Treasury ratios for 10-year and shorter maturities quite rich at under 60%, extending maturities further out the curve have the added benefit of more appealing relative yields. Ratios in 20-year and longer maturities remain attractive, relative to Treasuries, due to seasonal activity and wider spreads. However, the yield curve remains very flat over these longer tenors. For investors seeking to maximize curve positioning with relative value, the 17 to 20-year part of the municipal yield curve has become very tempting with slopes of 15 to 16-bps per year.
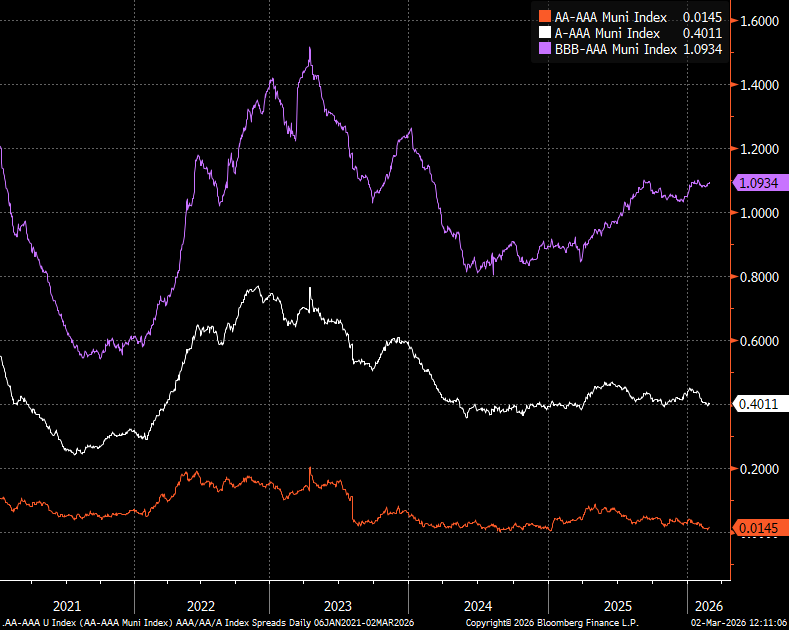
Credit risk continues to be rewarded, with ‘BBB’ credit spreads generally widening in 2026. However, ‘A’ and ‘AA’ credit spreads have been tightening due to reduced risk appetite as investors move into higher rated sectors and credits amid global and economic uncertainty. While selective assumption of risk continues to be rewarded for lower investment grade and high-yield credits, investors considering assuming credit risk should be cautious due to the potential for credit spread widening.
The municipal new issue calendar expands this week to $11.8 billion of new issues. Notable issues include: the City of Houston, TX, which plans to sell $1.43 billion in hotel occupancy tax & special revenue bonds, Arizona Transportation Board is scheduled to sell $786.3 million, and Lamar Consolidated Independent School Board is expected to sell a $545 million issue. This week’s deals should see a strong reception following 14 consecutive weeks of inflows, with approximately $1 billion being added to municipal bond funds last week, according to LSEG Lipper Global Fund Flows. Considering current muni/Treasury ratios, it is not surprising that the majority of inflows are going to intermediate and long-term muni funds.
Herbert J. Sims & Co. Inc. is a SEC registered broker-dealer, a member of FINRA, SIPC. The information contained herein has been prepared based upon publicly available sources believed to be reliable; however, HJ Sims does not warrant its completeness or accuracy and no independent verification has been made as to its accuracy or completeness. The information contained has been prepared and is distributed solely for informational purposes and is not a solicitation or an offer to buy or sell any security or instrument or to participate in any trading or investment strategy, and is subject to change without notice. All investments include risks. Nothing in this message or report constitutes or should be construed to be accounting, tax, investment or legal advice.
Despite the headlines and anxiety leading up to last week’s supreme court ruling, which determined the reciprocal tariffs are illegal, the bond market’s response was fairly measured. The Treasury market initially reacted with longer dated yields jumping approximately 6 basis points to 4.75%, before settling back as more information emerged. The muted response was partly due to the markets anticipating the ruling by pricing-in the outcome in advance and partly due to the potential for replacement tariffs. However, there remains significant uncertainty about when, or if, the billions in collected tariffs will be refunded. Should the tariffs be refunded, the bond market currently anticipates the burden will be shifted to Treasury issuance and result in higher yields.
Last week both the municipal bond market and the Treasury market were little changed. Munis rallied three to four basis points on the long-end of the yield curve as $14 billion in mid-month principal payments poured in during a shortened holiday week. Treasuries were essentially unchanged, with adjustments primarily around the policy sensitive two-year tenor. Slopes along the municipal yield curve remain consistently steep from 10 to 20-years, with 137 bps of slope compared to 46 bps from 1 to 10-years and 34 bps from 21 to 30-years.
Currently, Investors benefit from positioning in the intermediate/longer portion of the yield curve. In addition, a steep roll-down over time is drawing investors out the curve with some protection against rising rates. Due flattening past 20-years, municipal bond investors can currently buy maturities under 20-years that yield almost 90% of the 30-year curve. With muni/Treasury ratios for 10-year and shorter maturities quite rich at under 60% of Treasuries, extending maturities further out the curve has the added benefit of more appealing relative yields. Ratios in 20-year and longer maturities remain attractive, relative to Treasuries, due to seasonal activity and wider spreads. However, the yield curve remains very flat over these longer tenors. For investors seeking to maximize curve positioning with relative value, the 17 to 20-year part of the municipal yield curve has become very tempting with slopes of 15 to 16-bps per year.

The municipal new issue calendar expands this week to $10.6 billion of new issues. Notable issues include: the University of California with $2.0 billion of bonds, Lee County Florida is scheduled to sell $681.3 million in airport revenue bonds, and the Santa Clara Financing Authority is expected to sell a $396.3 million issue. This week’s deals should see a strong reception following 13 consecutive weeks of inflows, with approximately $1.3 billion being added to municipal bond funds last week alone, according to LSEG Lipper Global Fund Flows. Considering current muni/Treasury ratios, it is not surprising that the majority of inflows are going to intermediate and long-term muni funds, which reportedly received over $1 billion last week.
Herbert J. Sims & Co. Inc. is a SEC registered broker-dealer, a member of FINRA, SIPC. The information contained herein has been prepared based upon publicly available sources believed to be reliable; however, HJ Sims does not warrant its completeness or accuracy and no independent verification has been made as to its accuracy or completeness. The information contained has been prepared and is distributed solely for informational purposes and is not a solicitation or an offer to buy or sell any security or instrument or to participate in any trading or investment strategy, and is subject to change without notice. All investments include risks. Nothing in this message or report constitutes or should be construed to be accounting, tax, investment or legal advice.
Our team of market analysts have a singular mission: to help you make better investment decisions. Read the latest market commentary.
Continue readingOur team of market analysts have a singular mission: to help you make better investment decisions. Read the latest market commentary.
Continue readingLast week we experienced the second government shutdown in just four months. Following the approval of a spending package by Congress last Tuesday afternoon, funding for the majority of federal agencies was secured through September. However, the package only funded Homeland Security through 2/13 (this Friday). Keep in mind that Homeland Security isn’t just ICE, it also includes: TSA, FEMA, the Coast Guard and the Secret Service. Should Homeland Security fail to receive funding, there is the potential for economic consequences and travel interruptions.
As a result of the shutdown, the Department of Labor was not able to issue its report on U.S. hiring in January, as scheduled last Friday. The Bureau of Labor Statistics has rescheduled the release of The Employment Situation for this Wednesday, February 11 and CPI is scheduled to be released on Friday. Unfortunately, the disruption in jobs data comes amid uncertainty regarding the strength of the labor market amid speculation about the timing of future interest rate cuts by the Fed. Currently, the fed-funds futures market is anticipating a 25bps cut later this year in June.
Over the past month, municipal bond yields have generally shifted lower, resulting in an overall steeper curve and shorter maturities outperforming longer maturities. The front-end of the curve has shifted lower roughly 33 bps for tenors shorter than 2-years due to strong demand from separately managed accounts and retail investors. However, Treasuries for maturities longer than 6- months have not moved meaningfully over the past month.
Slopes along the municipal yield curve have become consistently steep from 10 to 20-years, with 137 bps of slope compared to 49 bps from 1 to 10-years and 32 bps from 20 to 30-years. By positioning in the longer intermediate portion of the curve, investors benefit from a steep roll-down over time. Furthermore, due to flat long-term rates, municipal bond investors can currently buy maturities under 20-years that yield approximately 90% of the 30-year curve. With muni/Treasury ratios for 10-year and shorter maturities quite rich at around 60%, extending maturities further out the curve has the added benefit of more appealing relative yields. Ratios in 20-year and longer maturities remain attractive, relative to Treasuries, due to weaker demand and wider spreads. However, the yield curve remains very flat over these longer tenors. For investors seeking to maximize curve positioning with relative value, the 17 to 20-year part of the municipal yield curve has become very tempting with slopes of approximately 15-bps per year.
The municipal new issue calendar expands again this week with $13.6 billion of new issues scheduled to price. Notable issues include: the State of Washington with $1.3 billion of bonds, Houston Methodist Hospital Obligated Group has scheduled $1.26 billion, District of Columbia has a $929.6 million issue and Portland Public Schools, OR, is planning to sell $660 million. This week’s deals should see a strong reception following the second week of inflows over $2 billion with municipal bond funds receiving $2.4 billion last week, according to LSEG Lipper Global Fund Flows. Considering current muni/Treasury ratios, it is not surprising the majority of inflows are going to long-term muni funds, which reportedly received $1.8 billion.
Herbert J. Sims & Co. Inc. is a SEC registered broker-dealer, a member of FINRA, SIPC. The information contained herein has been prepared based upon publicly available sources believed to be reliable; however, HJ Sims does not warrant its completeness or accuracy and no independent verification has been made as to its accuracy or completeness. The information contained has been prepared and is distributed solely for informational purposes and is not a solicitation or an offer to buy or sell any security or instrument or to participate in any trading or investment strategy, and is subject to change without notice. All investments include risks. Nothing in this message or report constitutes or should be construed to be accounting, tax, investment or legal advice.
Our team of market analysts have a singular mission: to help you make better investment decisions. Read the latest market commentary.
Continue readingAlthough the Federal Reserve’s rate decision was the primary economic event last week, the President’s announcement of his Fed chair nominee was arguably more impactful. Markets had a mixed response to the selection of Kevin Warsh as the next Fed chair. While his qualifications, particularly his experience as Fed governor from 2006 to 2011, were welcome news; there remains significant uncertainty about how he will balance the attentions of the Federal Reserve. Fed policymakers have recently been divided on whether to prioritize labor market concerns or stubbornly high inflation that remains above target levels.
In addition, the partial shutdown of the government took effect on Saturday, as lawmakers struggle to find common ground on the funding of immigration agencies. However, since Congress already passed half of this year’s funding bills last year, several federal agencies and programs continue to operate through September. Nevertheless, the government shutdown still affects the departments of Defense, Homeland Security, Labor, Health and Human Services, Education, Treasury and Housing and Urban Development, in addition to agencies like the Securities and Exchange Commission. Also, should the shutdown persists through the week, Friday’s Labor Department’s jobs report could potentially be delayed.
Over the past week, municipal bond yields have shifted slightly lower. The front-end of the curve has dropped roughly two bps out to about 10-years, approximately three bps from 10 to 15 years and less than one bps out to 30-years. However, Treasuries sold off seven to eight bps on the long-end as the Treasury curve steepened amid Fed leadership uncertainty. Furthermore, both curves have steepened over the past month with yields falling on the short-end and rising slightly on the long-end as investors focus on shorter maturities amid uncertainty.
Recently, slopes along the municipal yield curve have become consistently steep from 10 to 20-years, with 134 bps of overall slope compared to 45 bps from 1 to 10-years and 32 bps from 20 to 30-years. By positioning in the longer intermediate portion of the curve, investors benefit from a steep roll-down over time. Furthermore, due to flat long-term rates, municipal bond investors can currently buy maturities under 20-years that yield approximately 90% of the 30-year curve. With muni/Treasury ratios for 10-year and shorter maturities quite rich at around 60%, extending maturities further out the curve has the added benefit of more appealing relative yields. Ratios from 20-years and longer remain attractive relative to Treasuries due to weaker demand and wider spreads. However, the yield curve remains very flat over these longer tenors. For investors seeking to maximize curve positioning with relative value, the 19-year part of the municipal yield curve has become very tempting with a combination of appealing relative yields and a steep slope that rewards extension.
U.S. State and local governments sold $34.9 billion of munis in January versus $36.7 billion a year ago, a decline of 5.1%, according to data compiled by Bloomberg League Tables. However, with over $8.29 billion in new deals on the calendar, issuance is expected to accelerate this week. Significant deals include: RiverSpring Health Senior Living Inc Obligated Group, which plans to sell $634.2 million of bonds, co-managed by HJ Sims; Washington Suburban Sanitary Commission, scheduled to sell $366.6 million; and, San Diego County Regional Transportation Commission, which plans to offer $343.3 million. In addition, investors will likely be receptive after adding $2.062 billion to municipal bond mutual funds last week following $993.6 million the prior week, according to LSEG Lipper data.
Herbert J. Sims & Co. Inc. is a SEC registered broker-dealer, a member of FINRA, SIPC. The information contained herein has been prepared based upon publicly available sources believed to be reliable; however, HJ Sims does not warrant its completeness or accuracy and no independent verification has been made as to its accuracy or completeness. The information contained has been prepared and is distributed solely for informational purposes and is not a solicitation or an offer to buy or sell any security or instrument or to participate in any trading or investment strategy, and is subject to change without notice. All investments include risks. Nothing in this message or report constitutes or should be construed to be accounting, tax, investment or legal advice.
Our team of market analysts have a singular mission: to help you make better investment decisions. Read the latest market commentary.
Continue readingThis morning on the trade desk, accounts are distracted by Winter Storm Fern, which has created havoc from Texas to Maine with 24 states declaring emergencies. In addition to widespread power outages, many roads and highways remain impassable and flight cancellations have reached levels not seen since the early days of the Pandemic. Despite the inclement weather, Treasuries rose over the five to 30-year tenors resulting in yields dropping to their lowest levels since last week’s volatility. Following a preliminary announcement by the Commerce Department of stronger than anticipated durable goods orders for November, gains were briefly pared.
Early last week, international events came into focus following instability in the Japanese bond market. Yields surged in the Japanese bond market following a pitch by Japanese Prime Minister Sanae Takaichi to cut taxes on food, which markets interpreted to mean increased government bond issuance. The result was 40-year Japanese yields jumping to the highest level of any maturity of the nation’s sovereign debt in more than three decades. In addition, escalating tensions over the control of Greenland with the threat of tariffs on European goods added to the melee. The municipal bond market responded to the uncertainty with bonds selling-off. As of the end of the day on Tuesday, MMD ultimately cut yields from 2bps in 2027-28 to 7 bps in 2041-56.
Despite the volatility early in the week, rates were relatively unchanged over the week. Treasuries outperformed munis with 30-year Treasury bonds rallying 3.3 bps while 30-year munis sold-off 8.7 bps. The overall result was a flatter Treasury curve and a steeper muni curve. Slopes along the municipal yield curve are steepest from 11 to 12 years, with 27 bps of slope and from 14 to 20-years, with 95 bps of slope. In addition, investors benefit from a steep roll-down over time. Although the municipal yield curve is currently rewarding duration, investors should be cautious when extending to maturities past 20-years, where the long-end becomes very flat. As a result of this flat tail, municipal bond investors can buy maturities under 20-years that yield over 90% of the 30-year curve.
Muni/Treasury ratios for 10-year and shorter maturities have seen significant declines over the past month due to a concentration of retail demand at the front end of the yield curve. However, this is a still an improvement from September, when ratios in the 1-year tenor dropped to as low as 56%. Ratios further out the curve, from 20-years and longer, remain attractive relative to Treasuries due to weaker demand and wider spreads. For investors seeking to maximize curve positioning with relative value, extending to the 19-year part of the municipal yield curve provides over 90% of the 30-year maturity and over 80% of equivalent Treasury yields. In the rich belly of the curve, particularly around 5-years, we are hearing reluctance from institutional investors citing these ratios as unappealing relative to the rest of the curve.
Municipal new issuance volume is expected to be relatively quiet this week, with a just over $4 billion on the calendar. Significant deals include $750 million from the Triborough Bridge & Tunnel Authority and Florida Health Sciences Center Inc. Obligated Group with $369.3 million. Furthermore, states and local governments are planning to issue just under $9 billion in new supply over the next 30 days, according to data compiled by Bloomberg. In addition, the FOMC is scheduled to hold its press conference later this week to brief the markets. Currently, markets expect the Fed to hold rates steady following three straight cuts last year. In addition, the markets will be looking to the Fed for signals about where rates are headed.
Herbert J. Sims & Co. Inc. is a SEC registered broker-dealer, a member of FINRA, SIPC. The information contained herein has been prepared based upon publicly available sources believed to be reliable; however, HJ Sims does not warrant its completeness or accuracy and no independent verification has been made as to its accuracy or completeness. The information contained has been prepared and is distributed solely for informational purposes and is not a solicitation or an offer to buy or sell any security or instrument or to participate in any trading or investment strategy, and is subject to change without notice. All investments include risks. Nothing in this message or report constitutes or should be construed to be accounting, tax, investment or legal advice.
Our team of market analysts have a singular mission: to help you make better investment decisions. Read the latest market commentary.
Continue readingOur team of market analysts have a singular mission: to help you make better investment decisions. Read the latest market commentary.
Continue reading