Overview
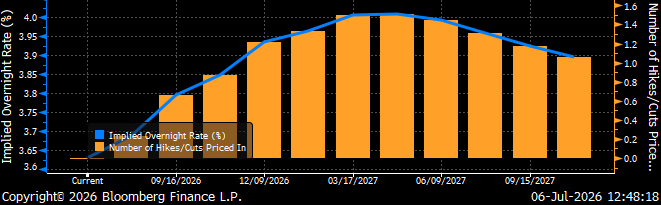
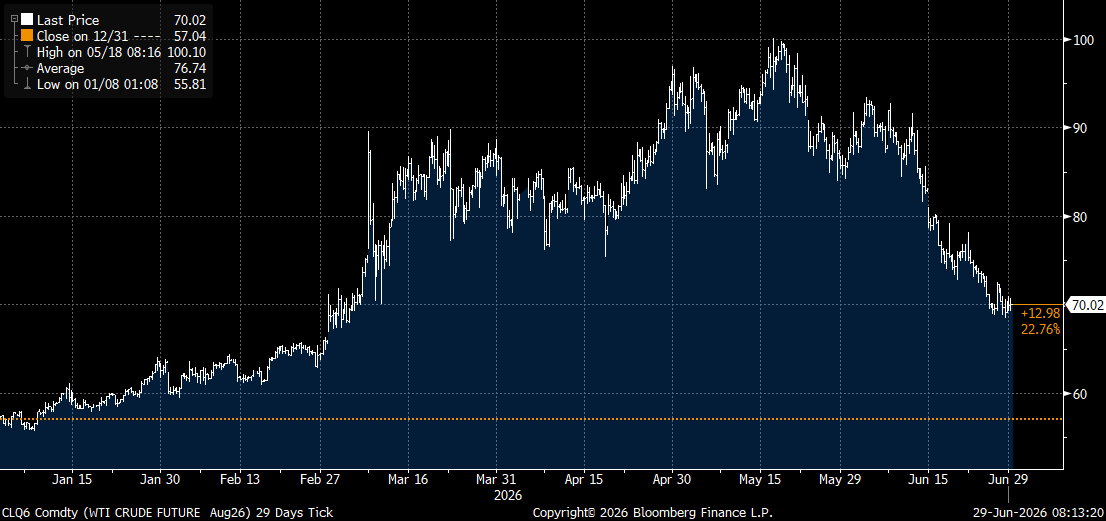
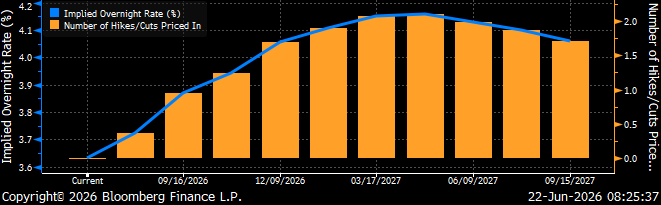
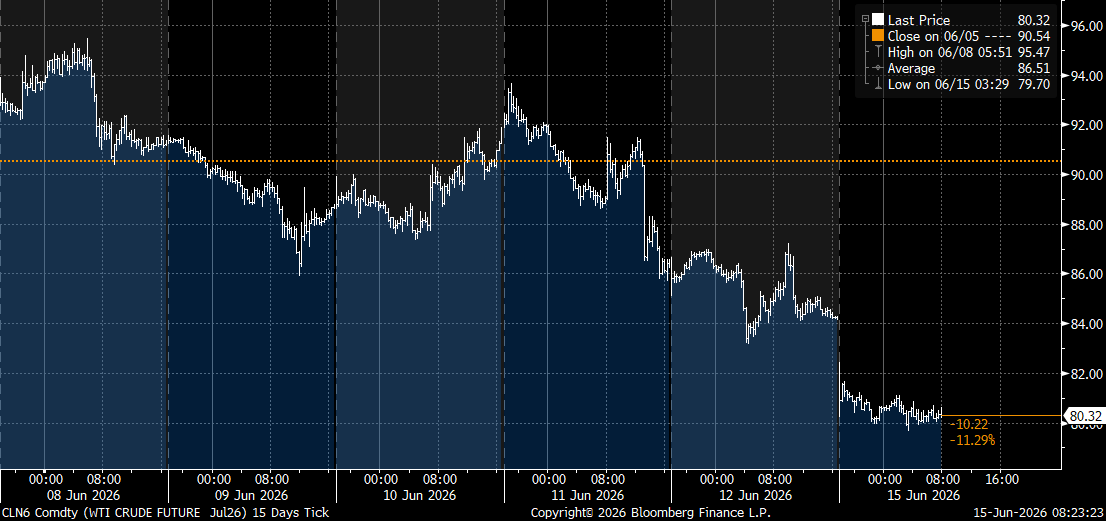
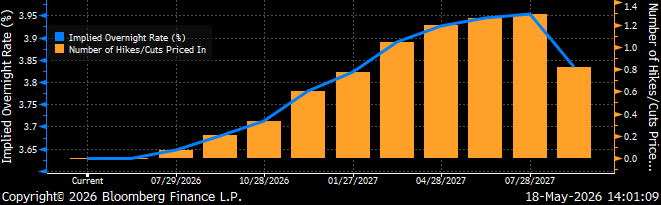
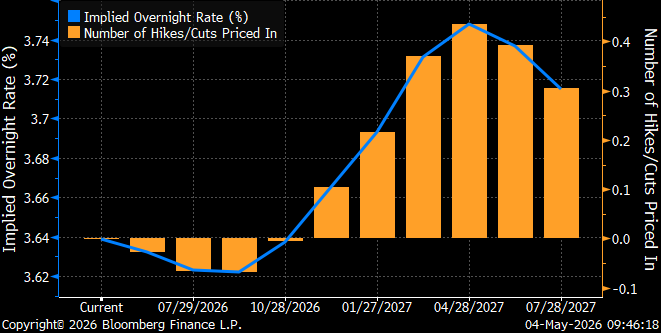
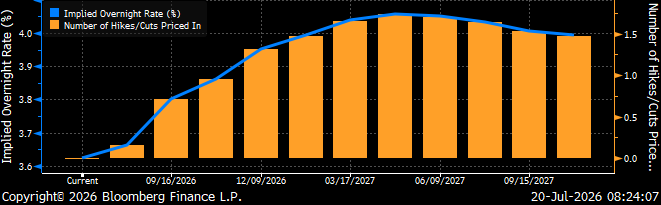
This morning, the war in Iran continues to make headlines amid the possibility of a 10-day ceasefire. With shipping traffic through the Strait of Hormuz reportedly at a virtual standstill, we are seeing some relief in oil prices this morning as optimism lifts for a potential peace deal. Last week, reports on US consumer and producer prices, came in much cooler than economists expected. This is important because these are the final inflation prints this month before the Fed’s meeting next week. As a result, Fed funds futures are now pricing in a Fed rate hike of 25bp by the October 27-28 meeting (97.5%); which, was previously thought to occur as soon as September. The current outlook for Fed policy has shifted from two quarter-point hikes by mid-2027, to one hike this year and possibly none next year with declining likelihood starting in June 2027.
Implied Overnight Rate & Number of Hikes/Cuts
Insights and Strategy
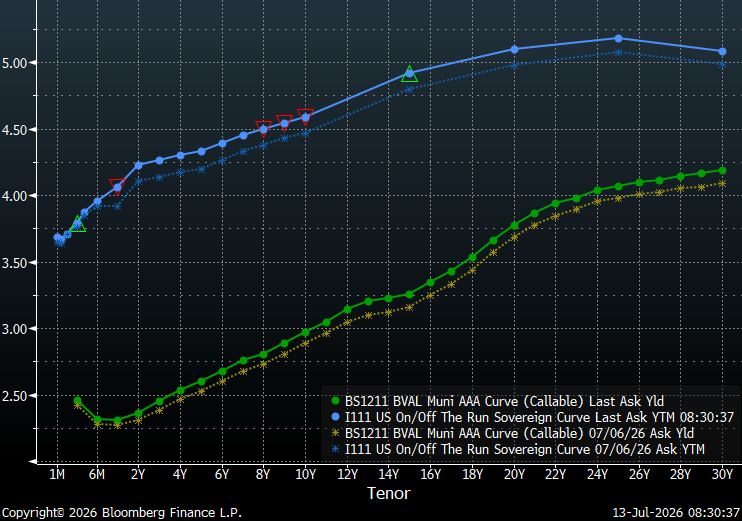
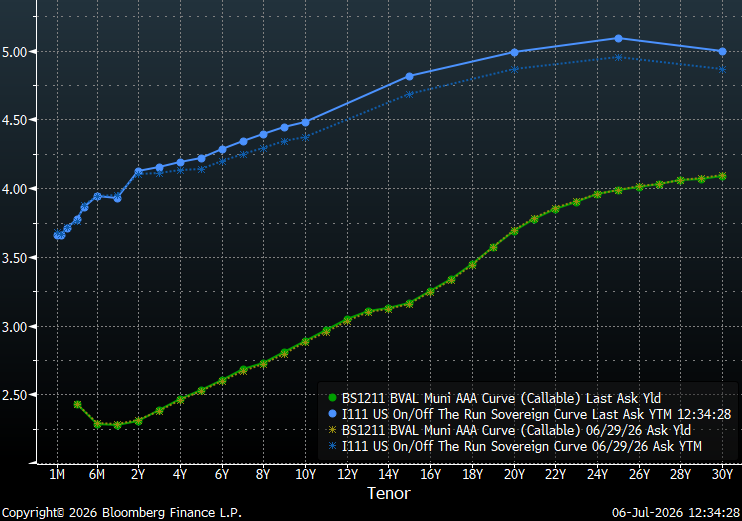
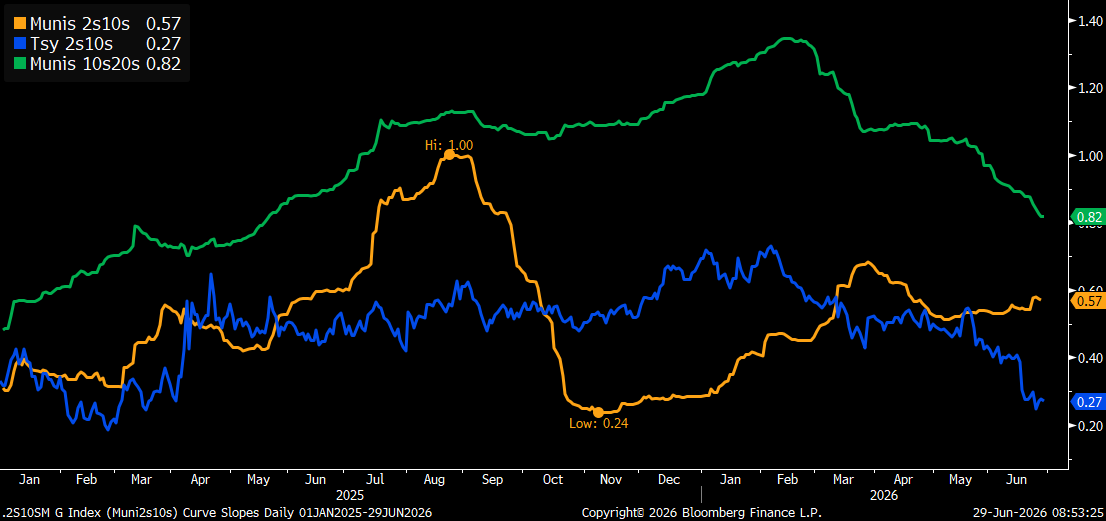
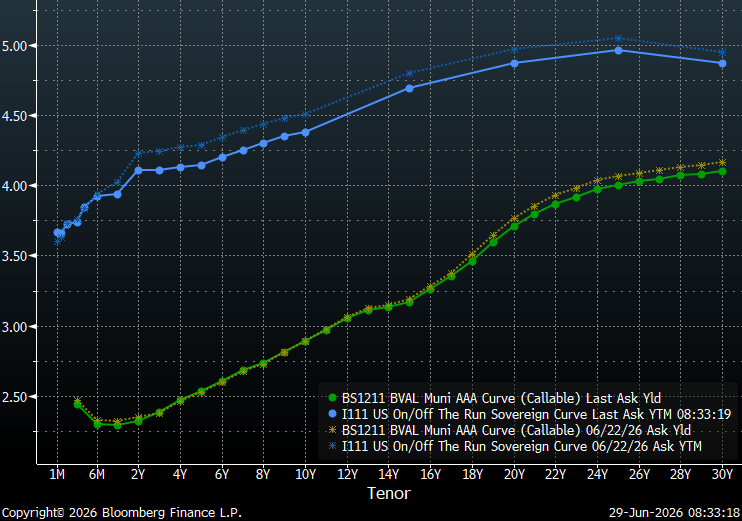
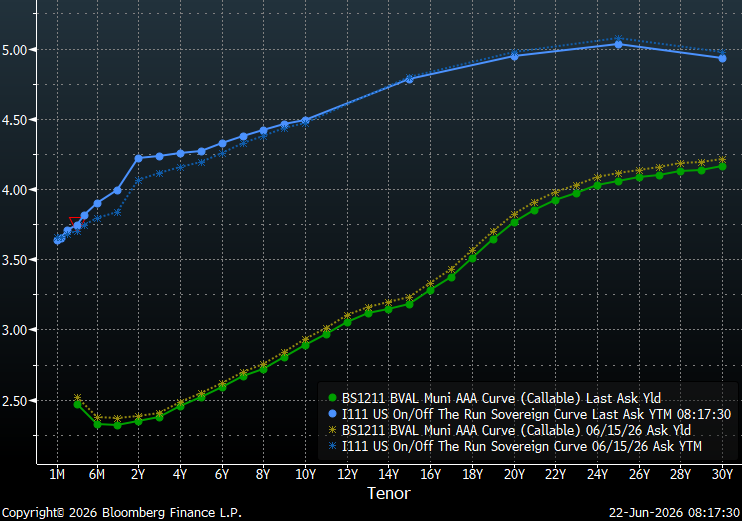
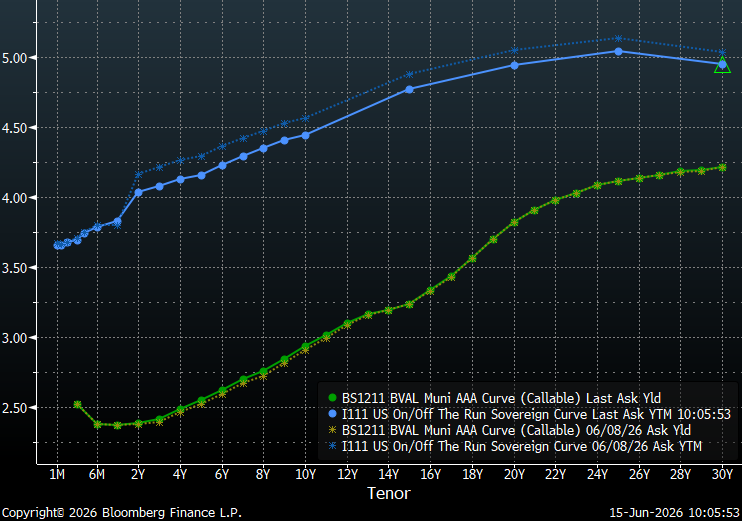
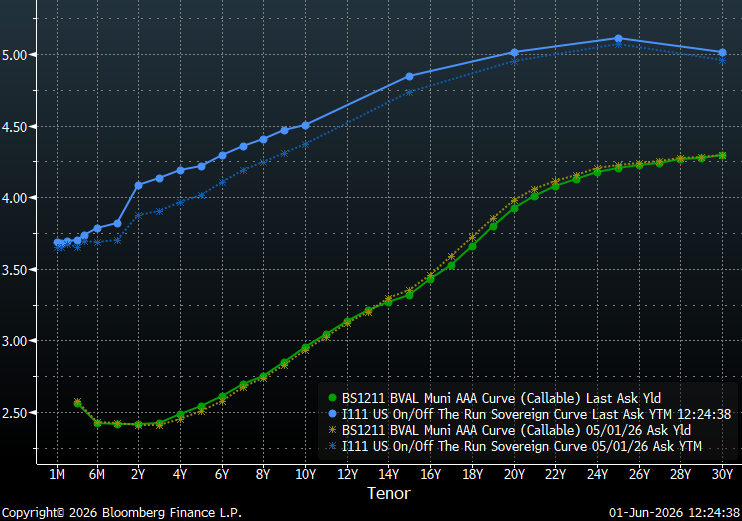
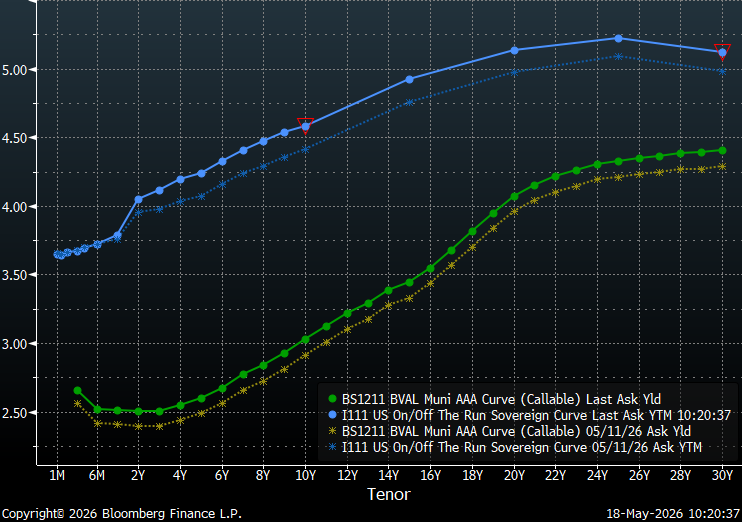
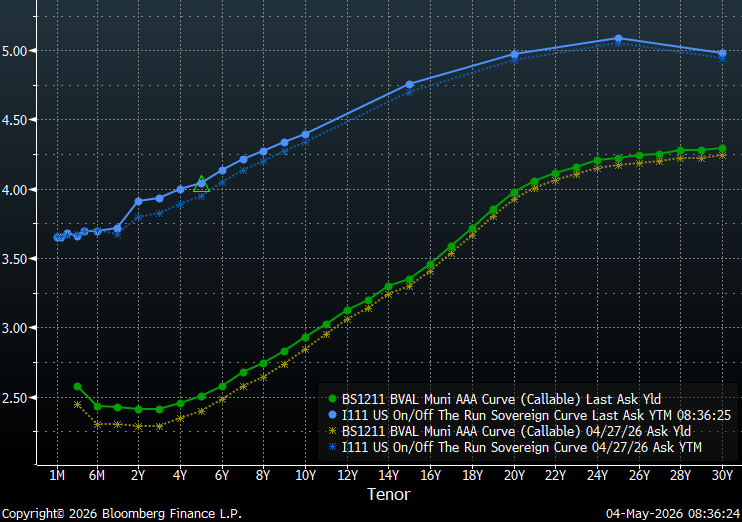
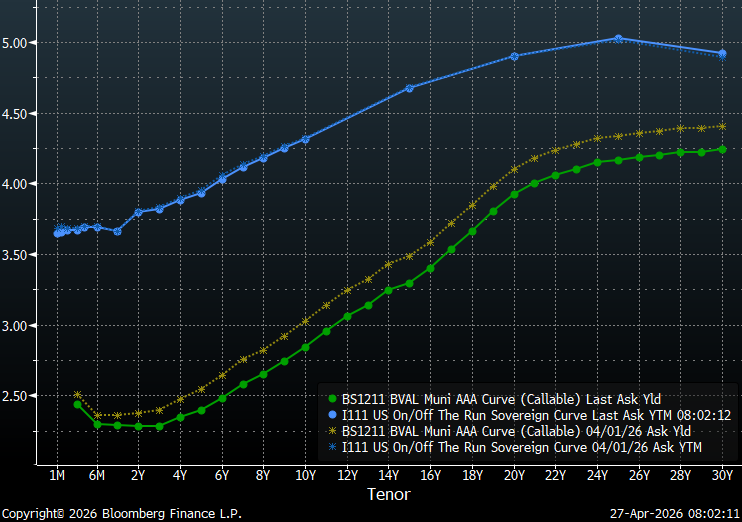
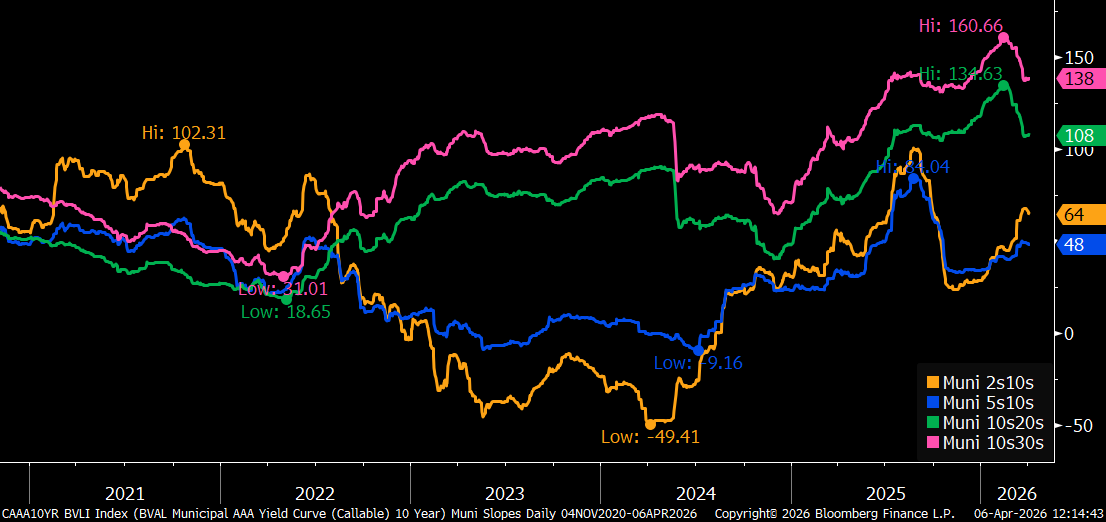
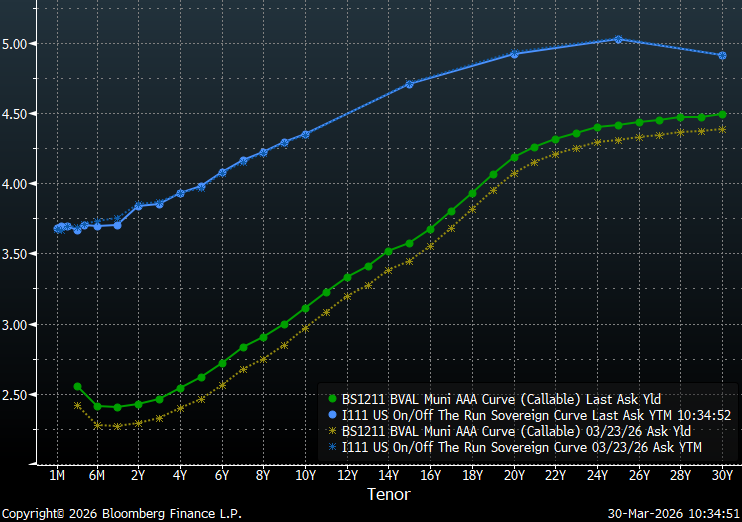
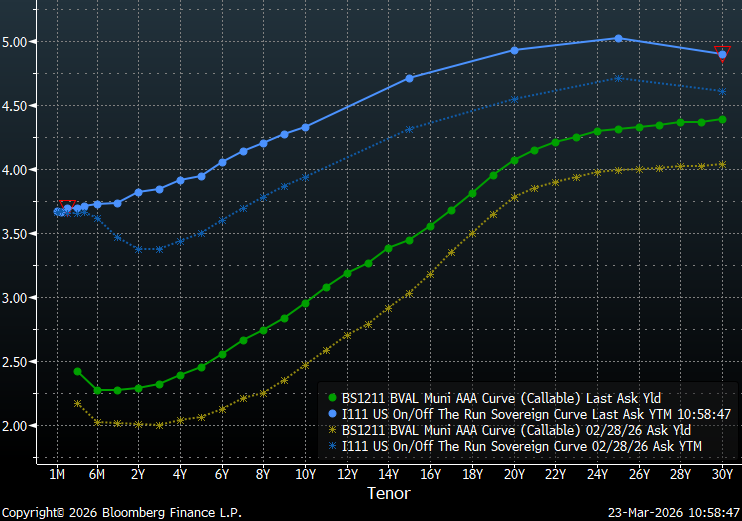
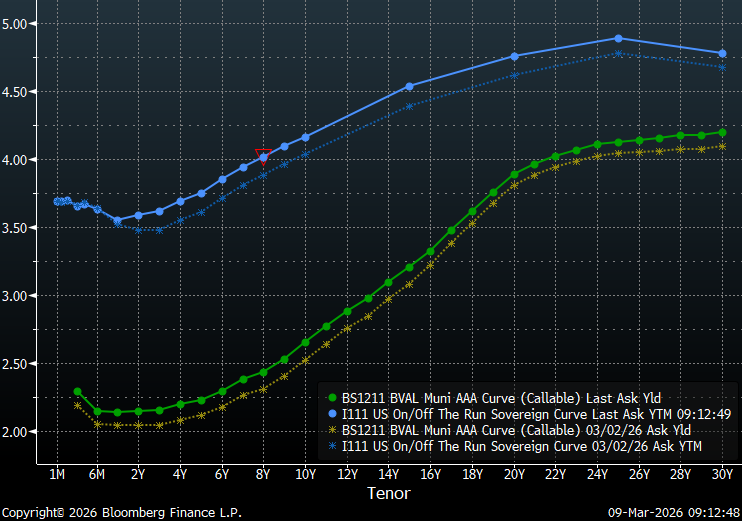
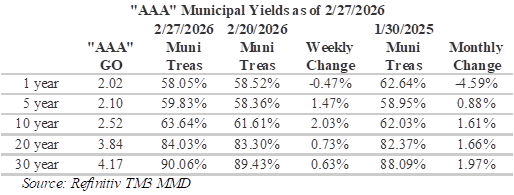
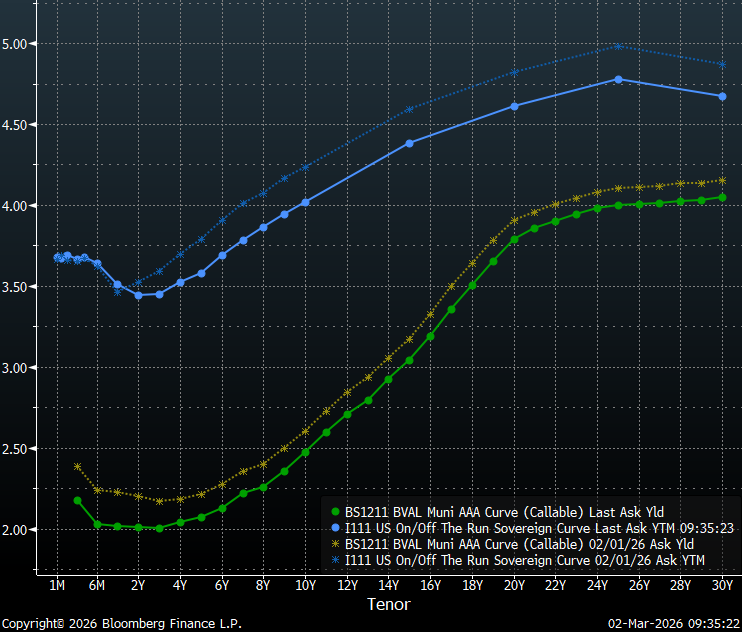
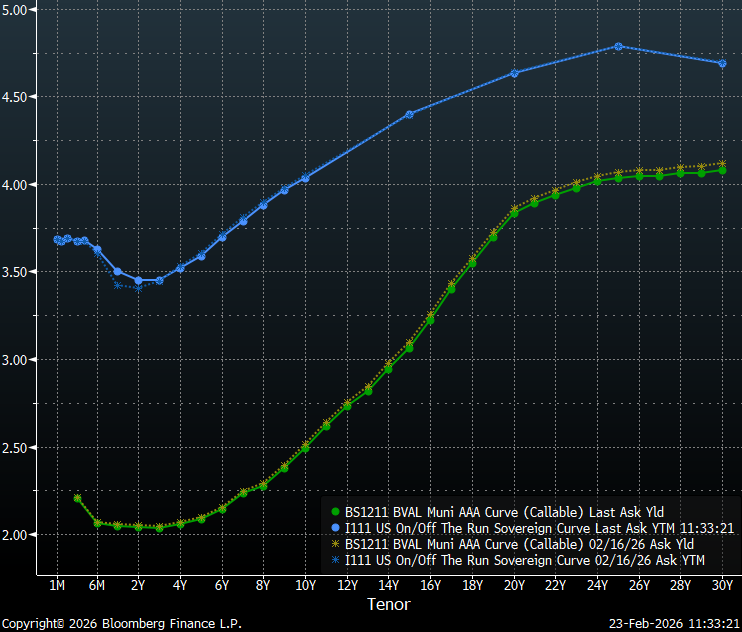
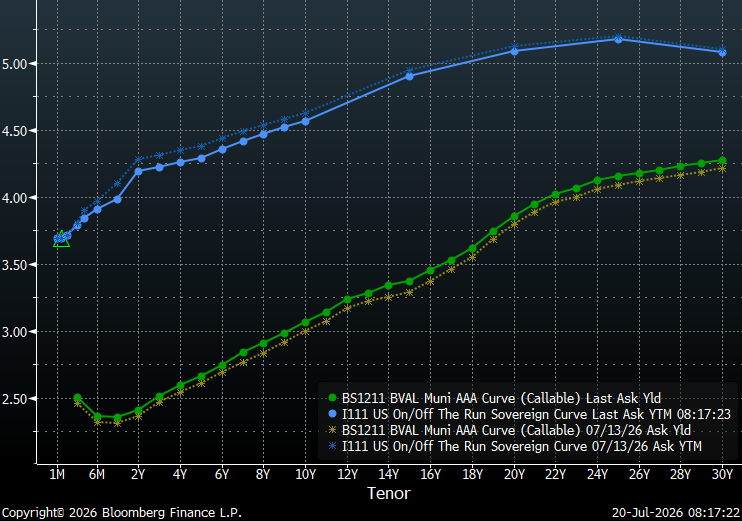
In response to last week’s inflation news, the Treasury curve dipped around the policy sensitive two-year tenor while the municipal yield curve shifted higher in response to technical factors. Inflation concerns with volatile energy prices continue to hold the long-end of the Treasury curve above 5% for maturities past 20-years. When comparing the municipal yield curve to the Treasury curve, the first 6 months immediately stand-out with the inverted shape of the municipal curve sharply contrasting with the steeply sloped Treasury curve. Also, as discussed in greater detail below, record issuance and rich ratios are creating some resistance in munis. The slope at the long-end of the municipal yield curve, past 20-years, remains relatively flat with a total slope of 30 bps from 21-30-years. Due to this flat tail, municipal bond investors can currently buy 20-year maturities that yield almost 91% of the 30-year curve versus 72.5% for 10-year maturities.
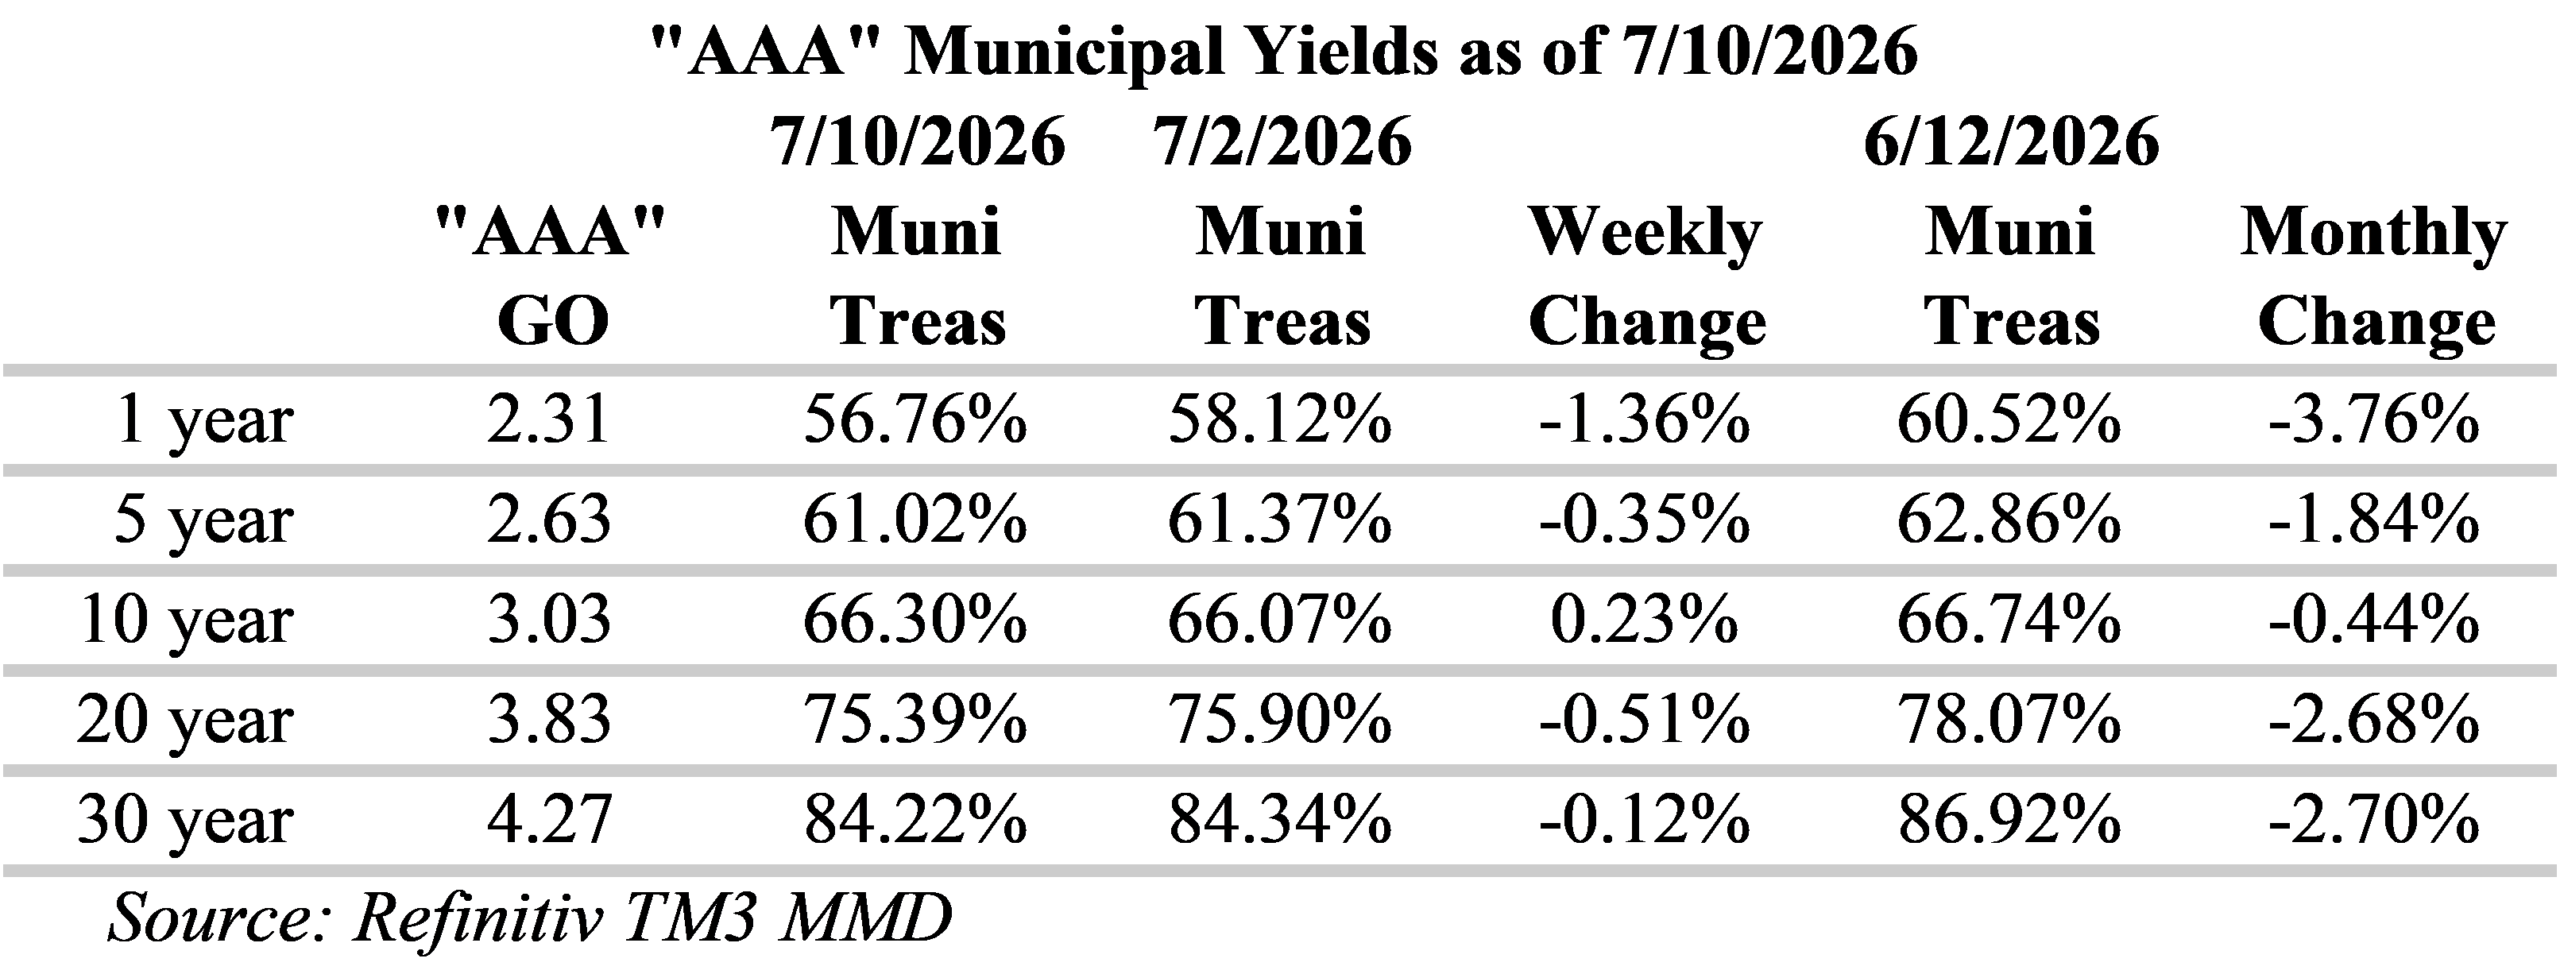
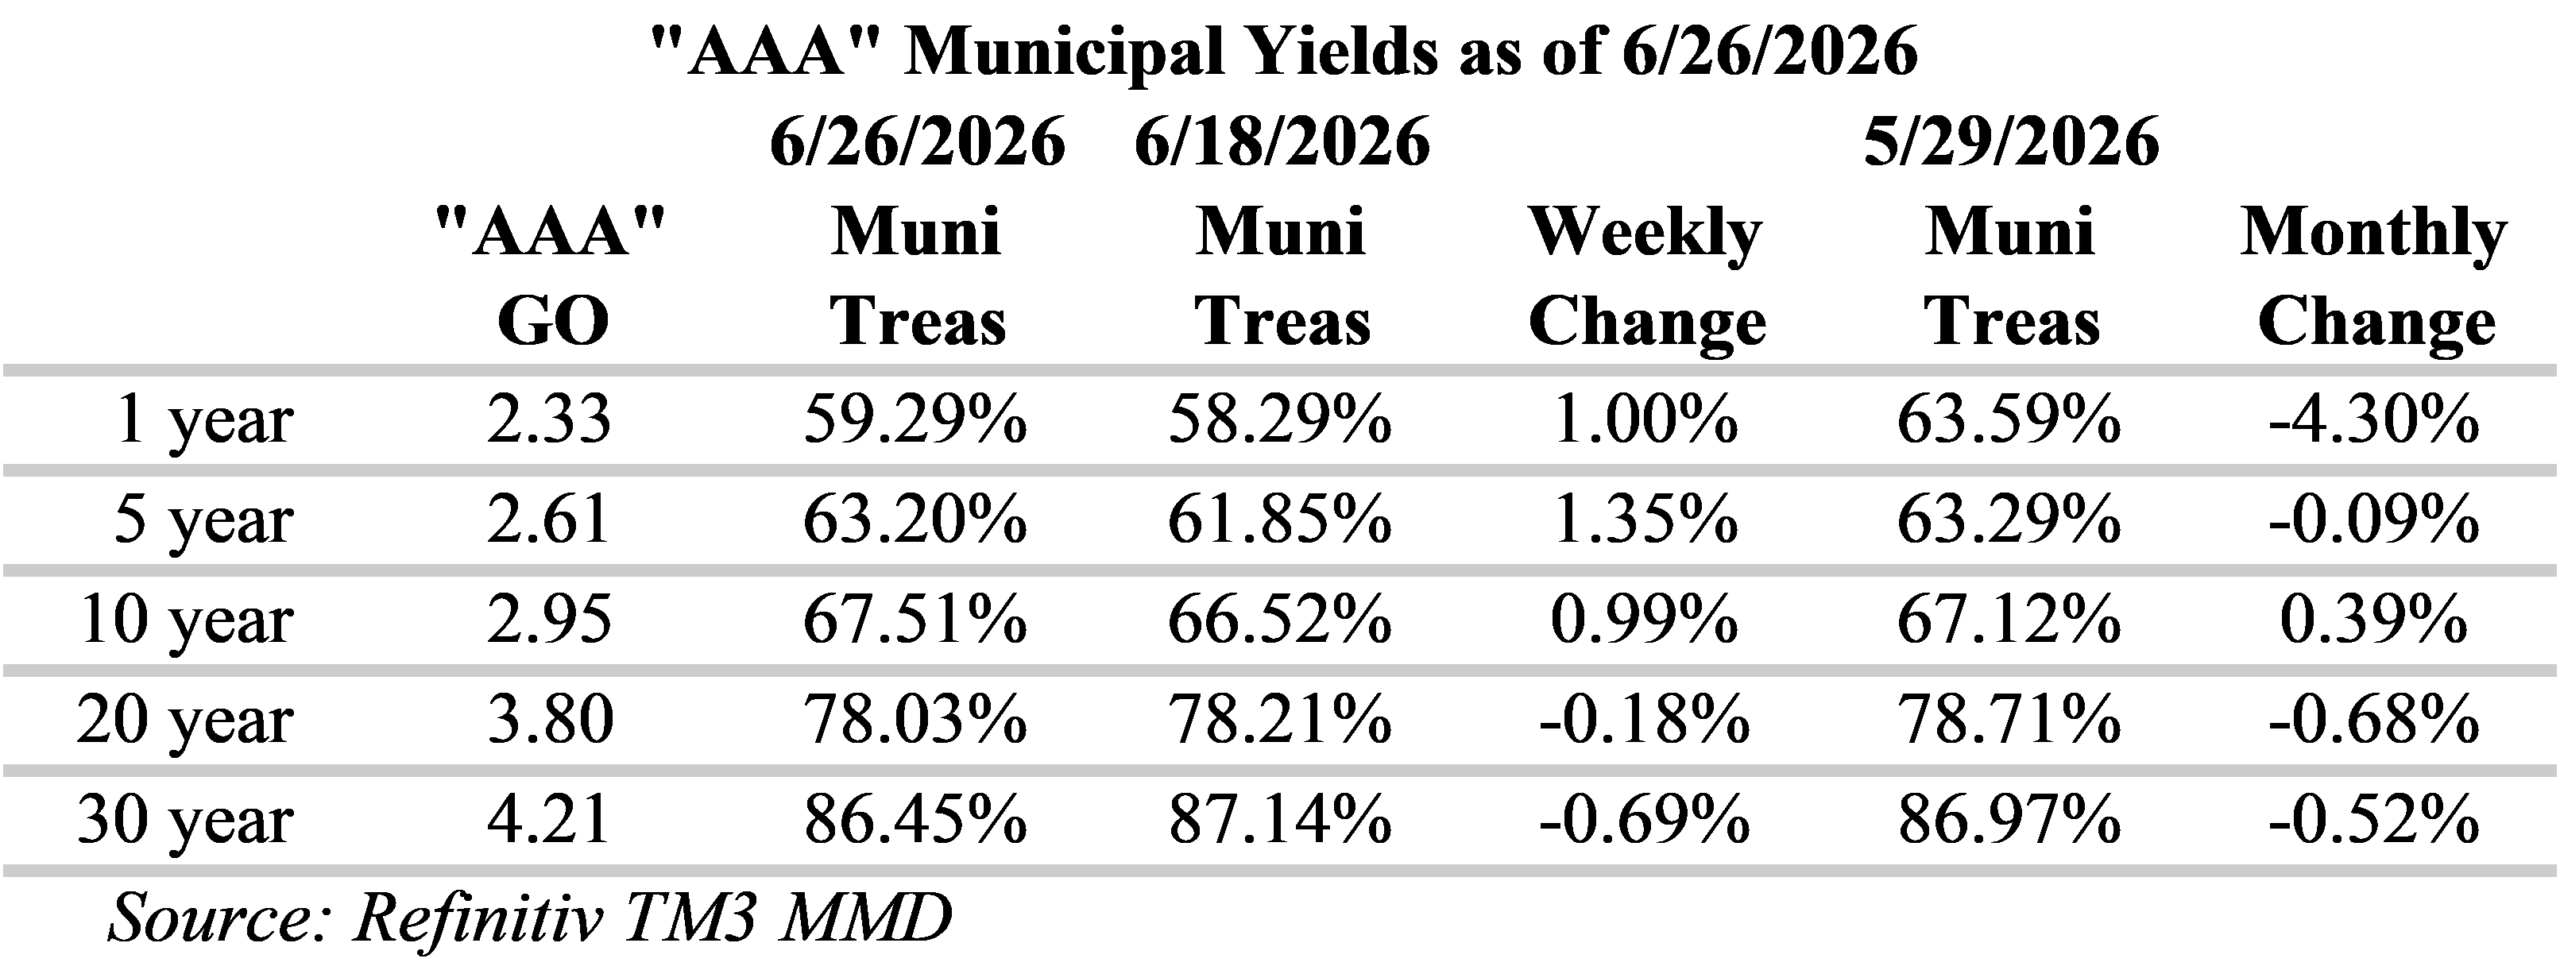
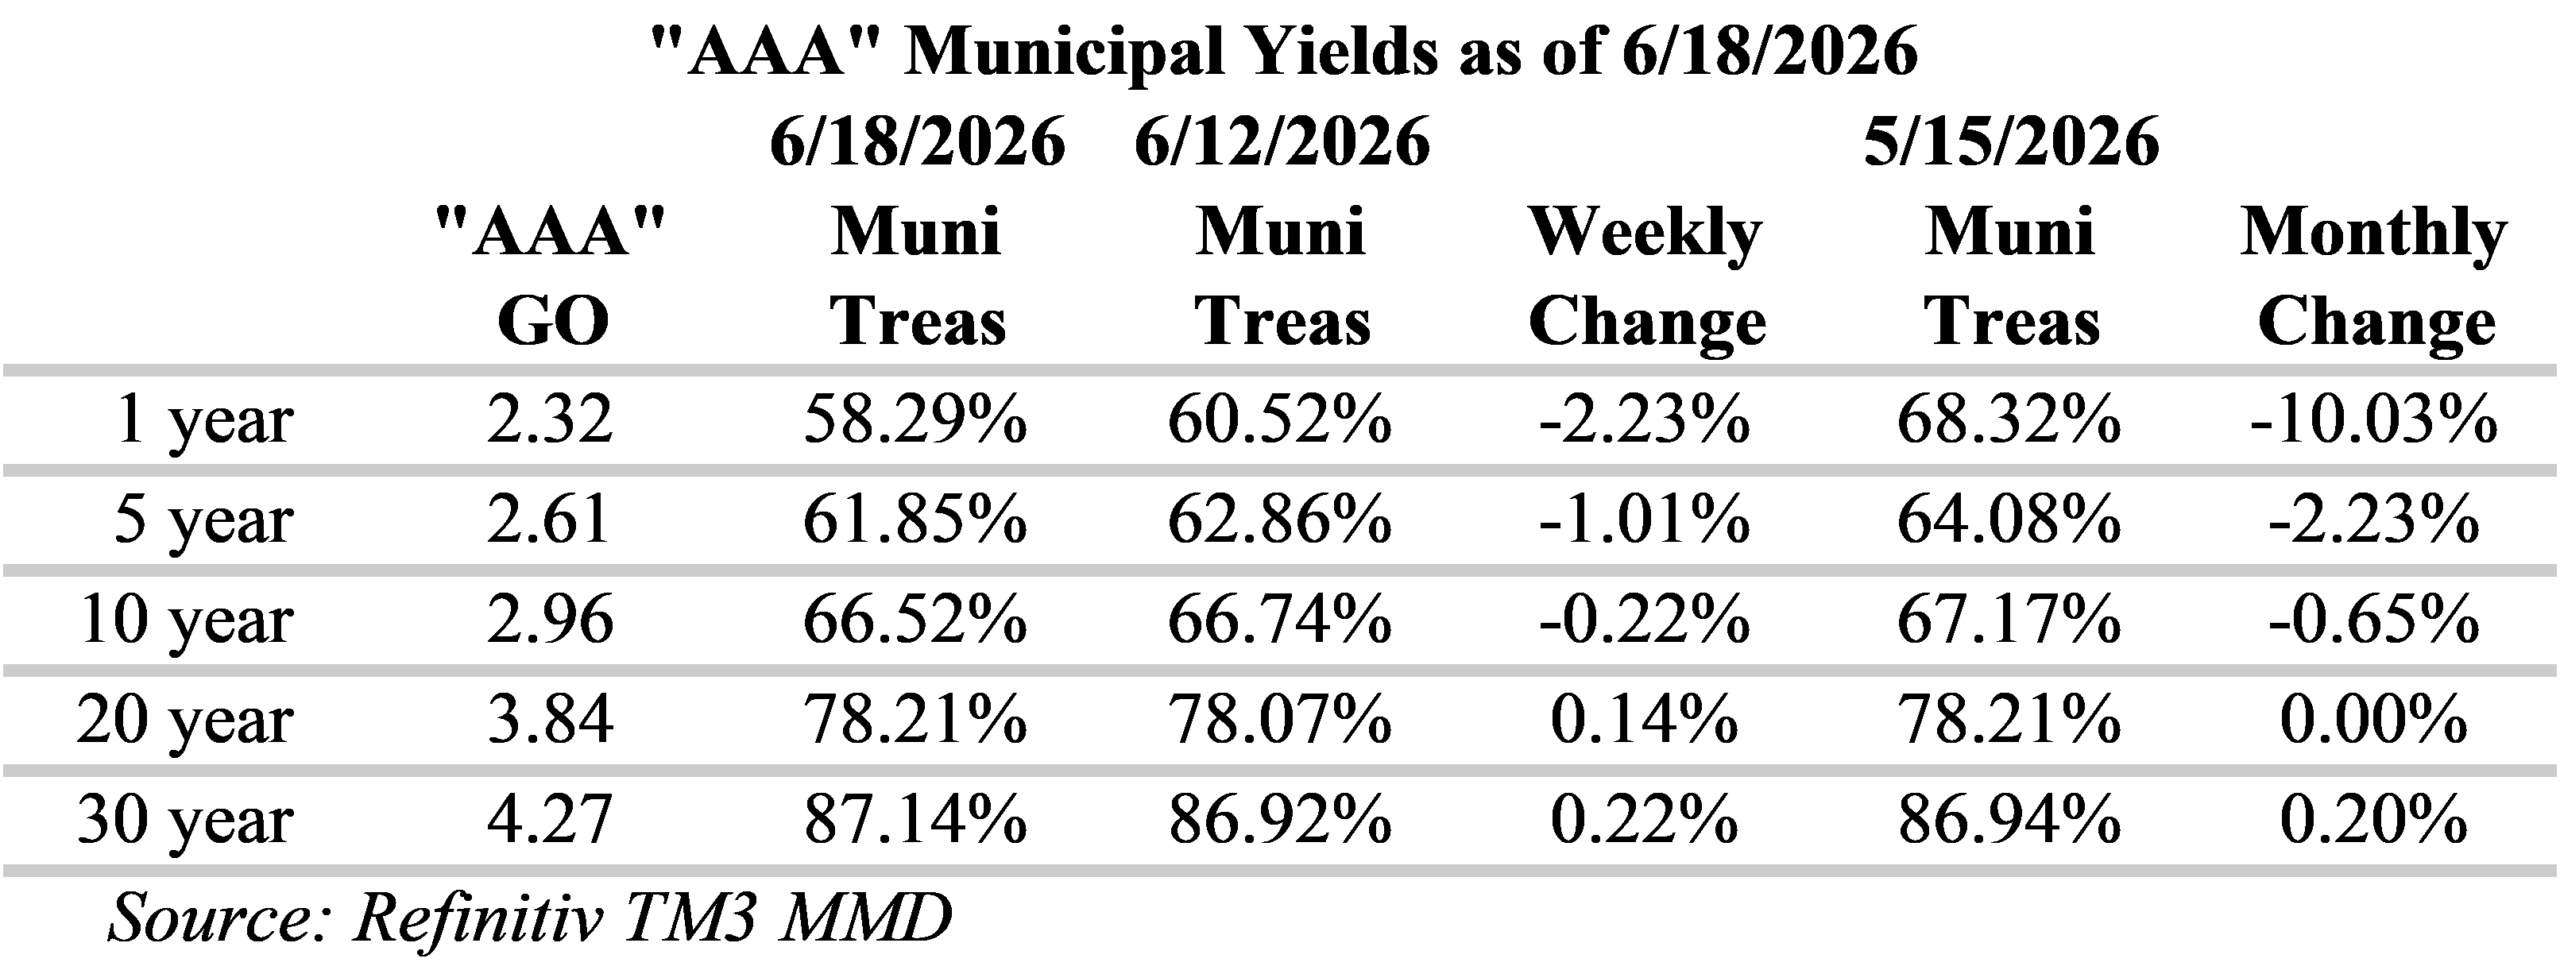
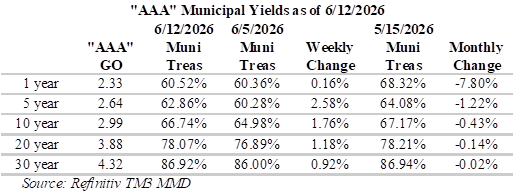
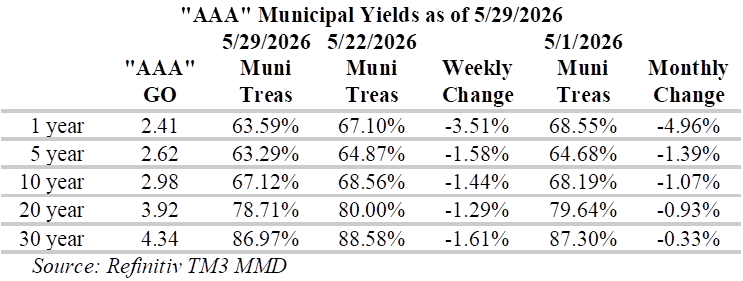
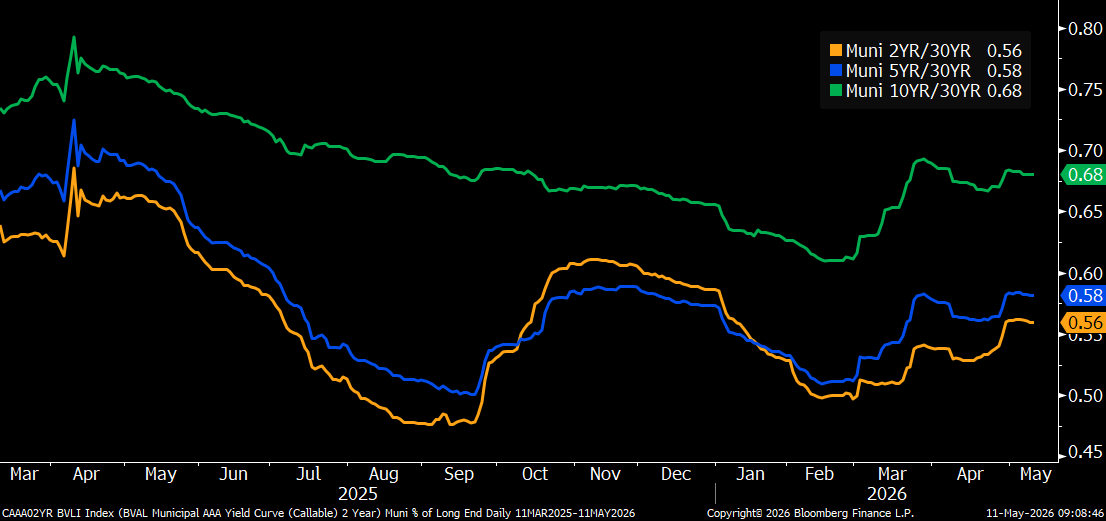
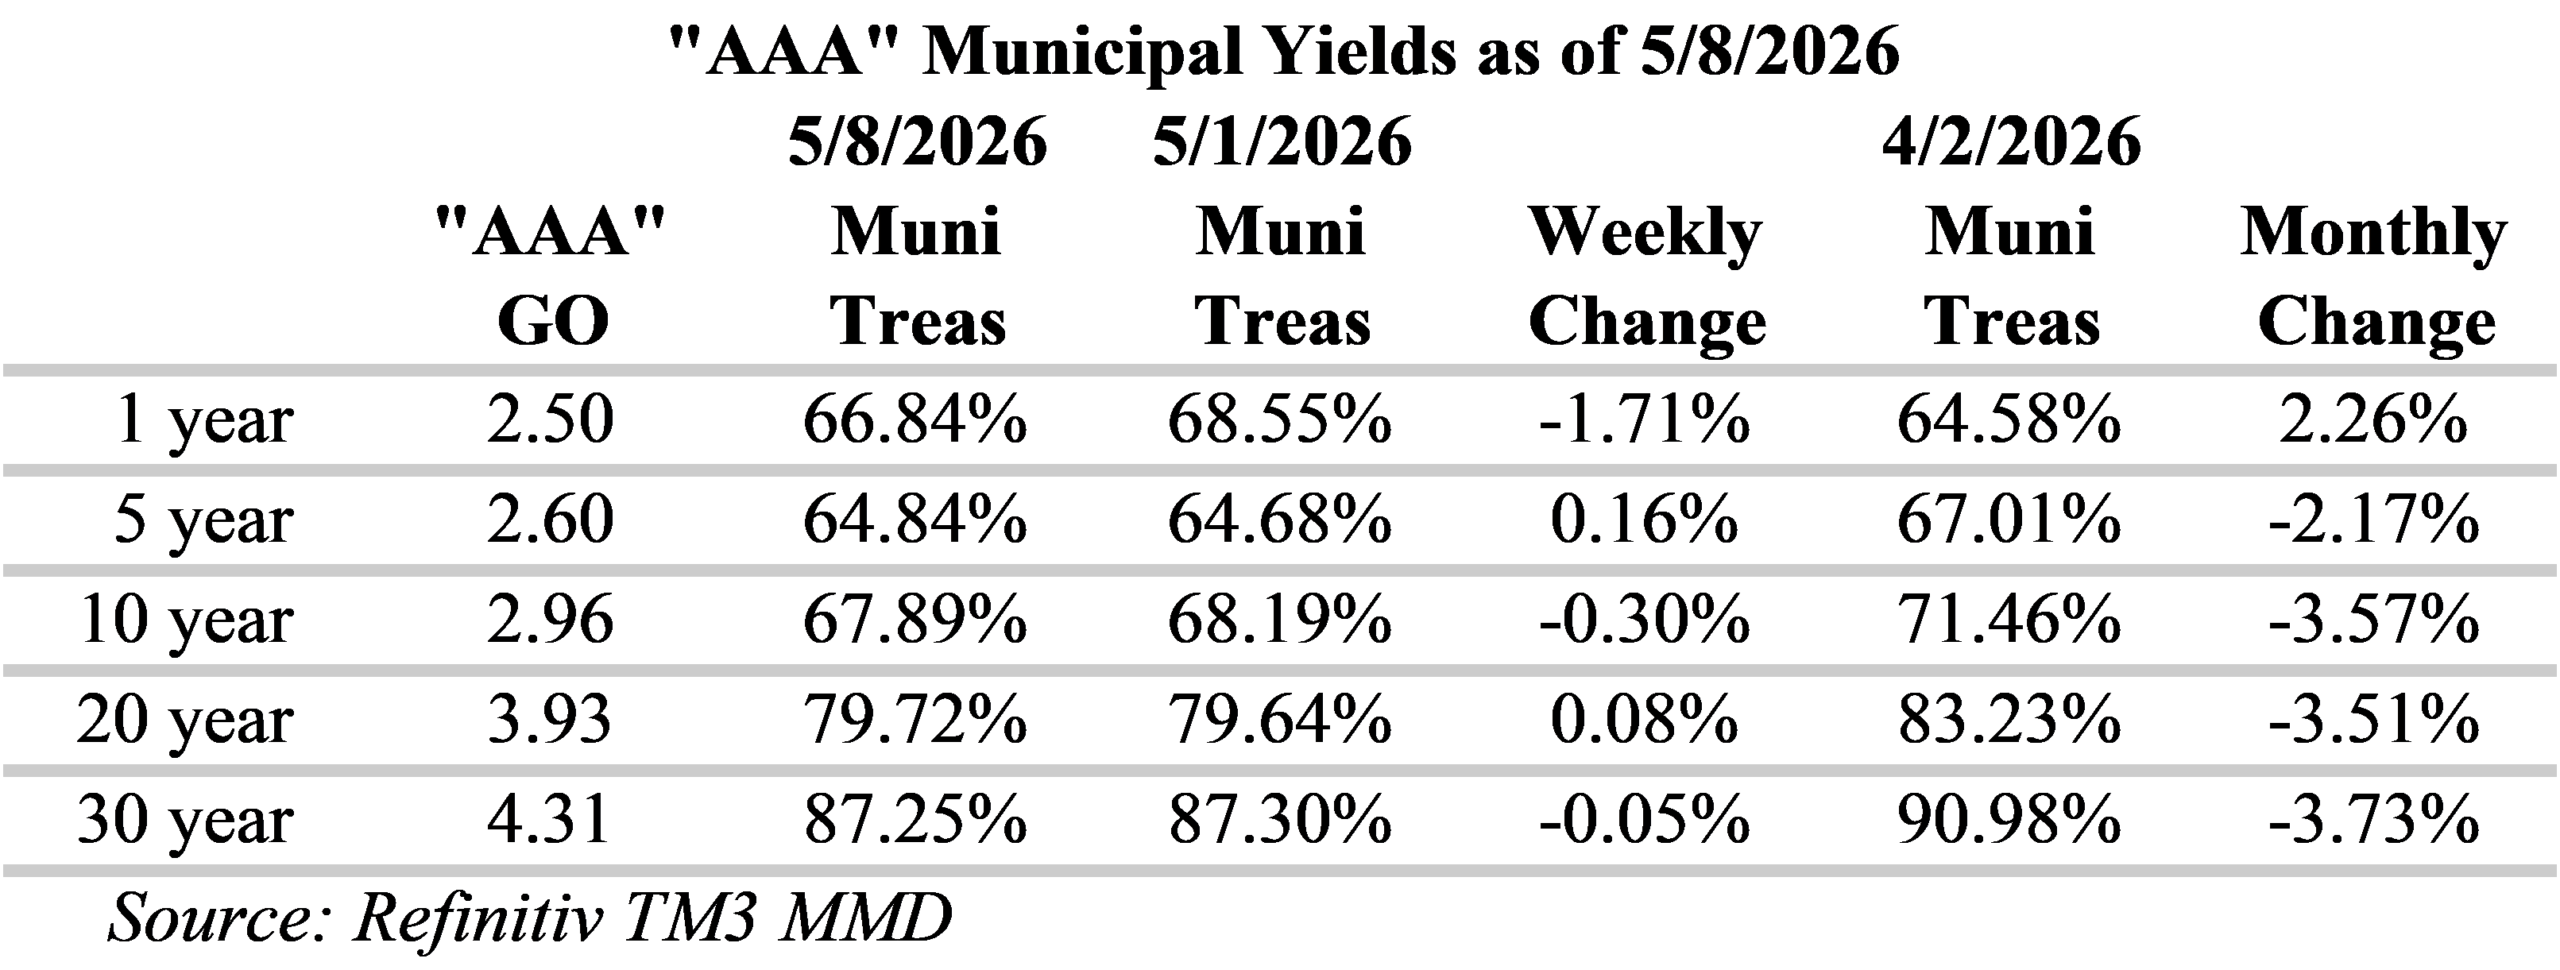
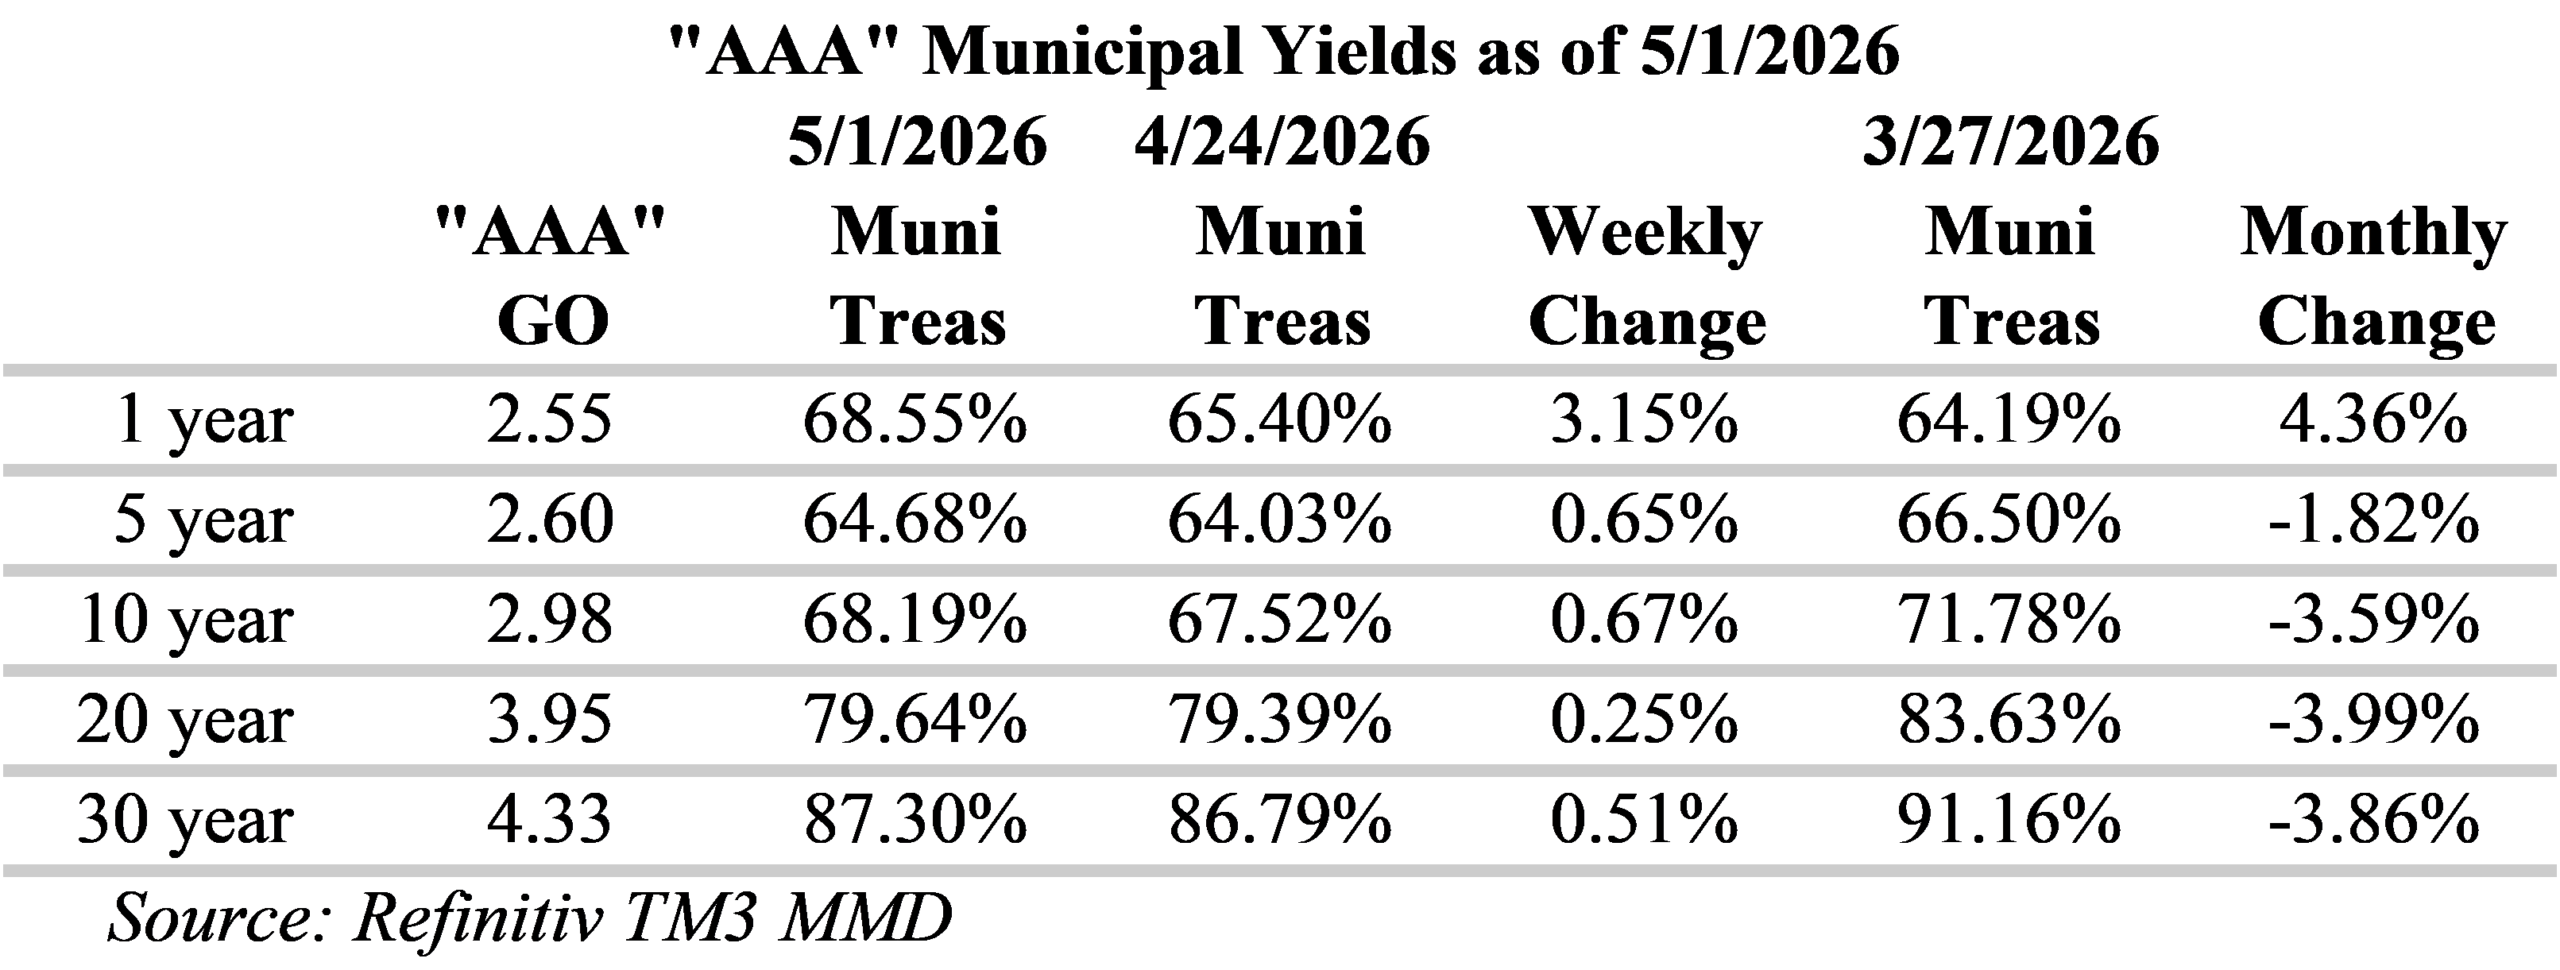
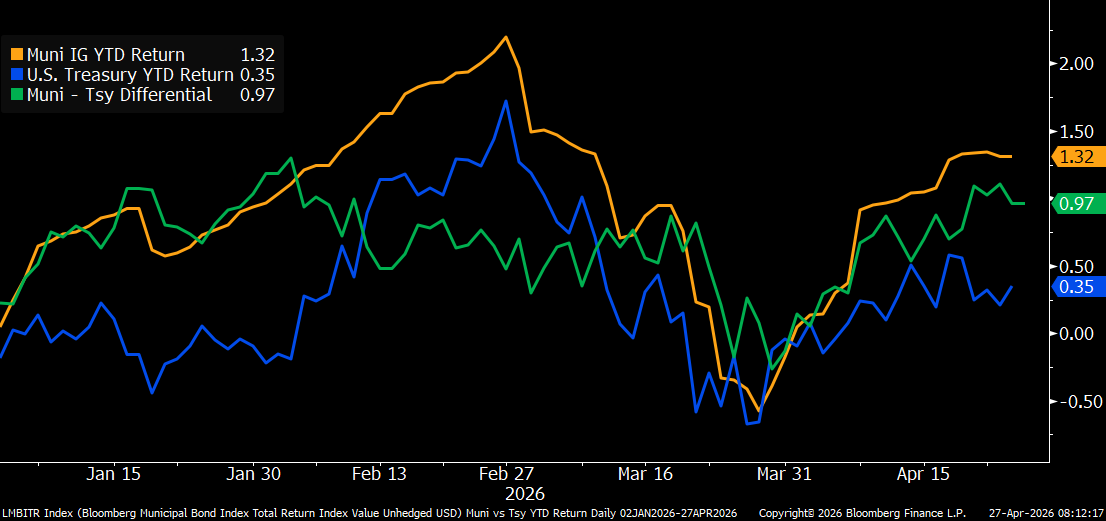
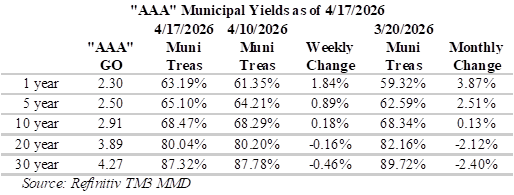
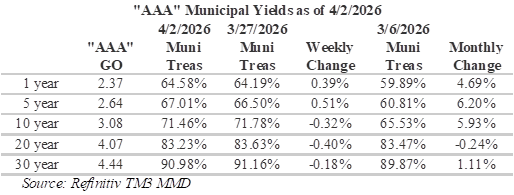
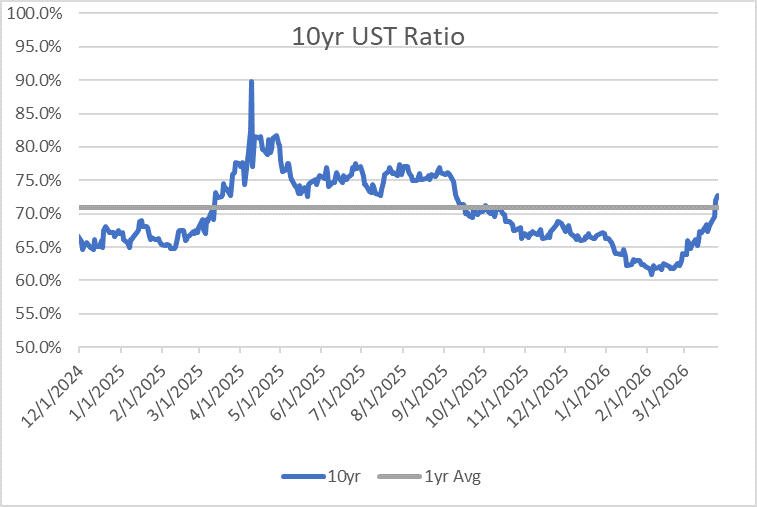
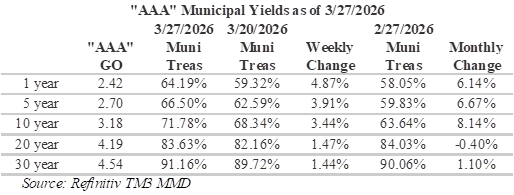
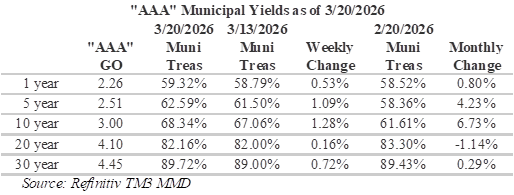
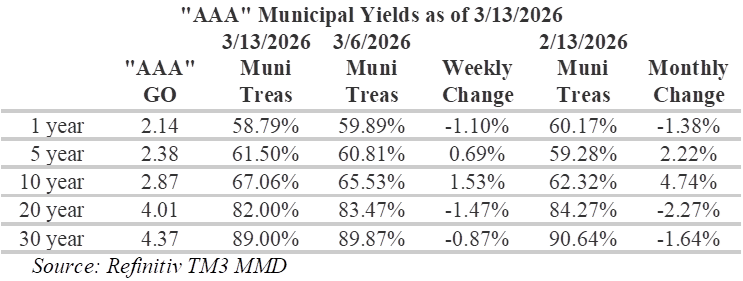
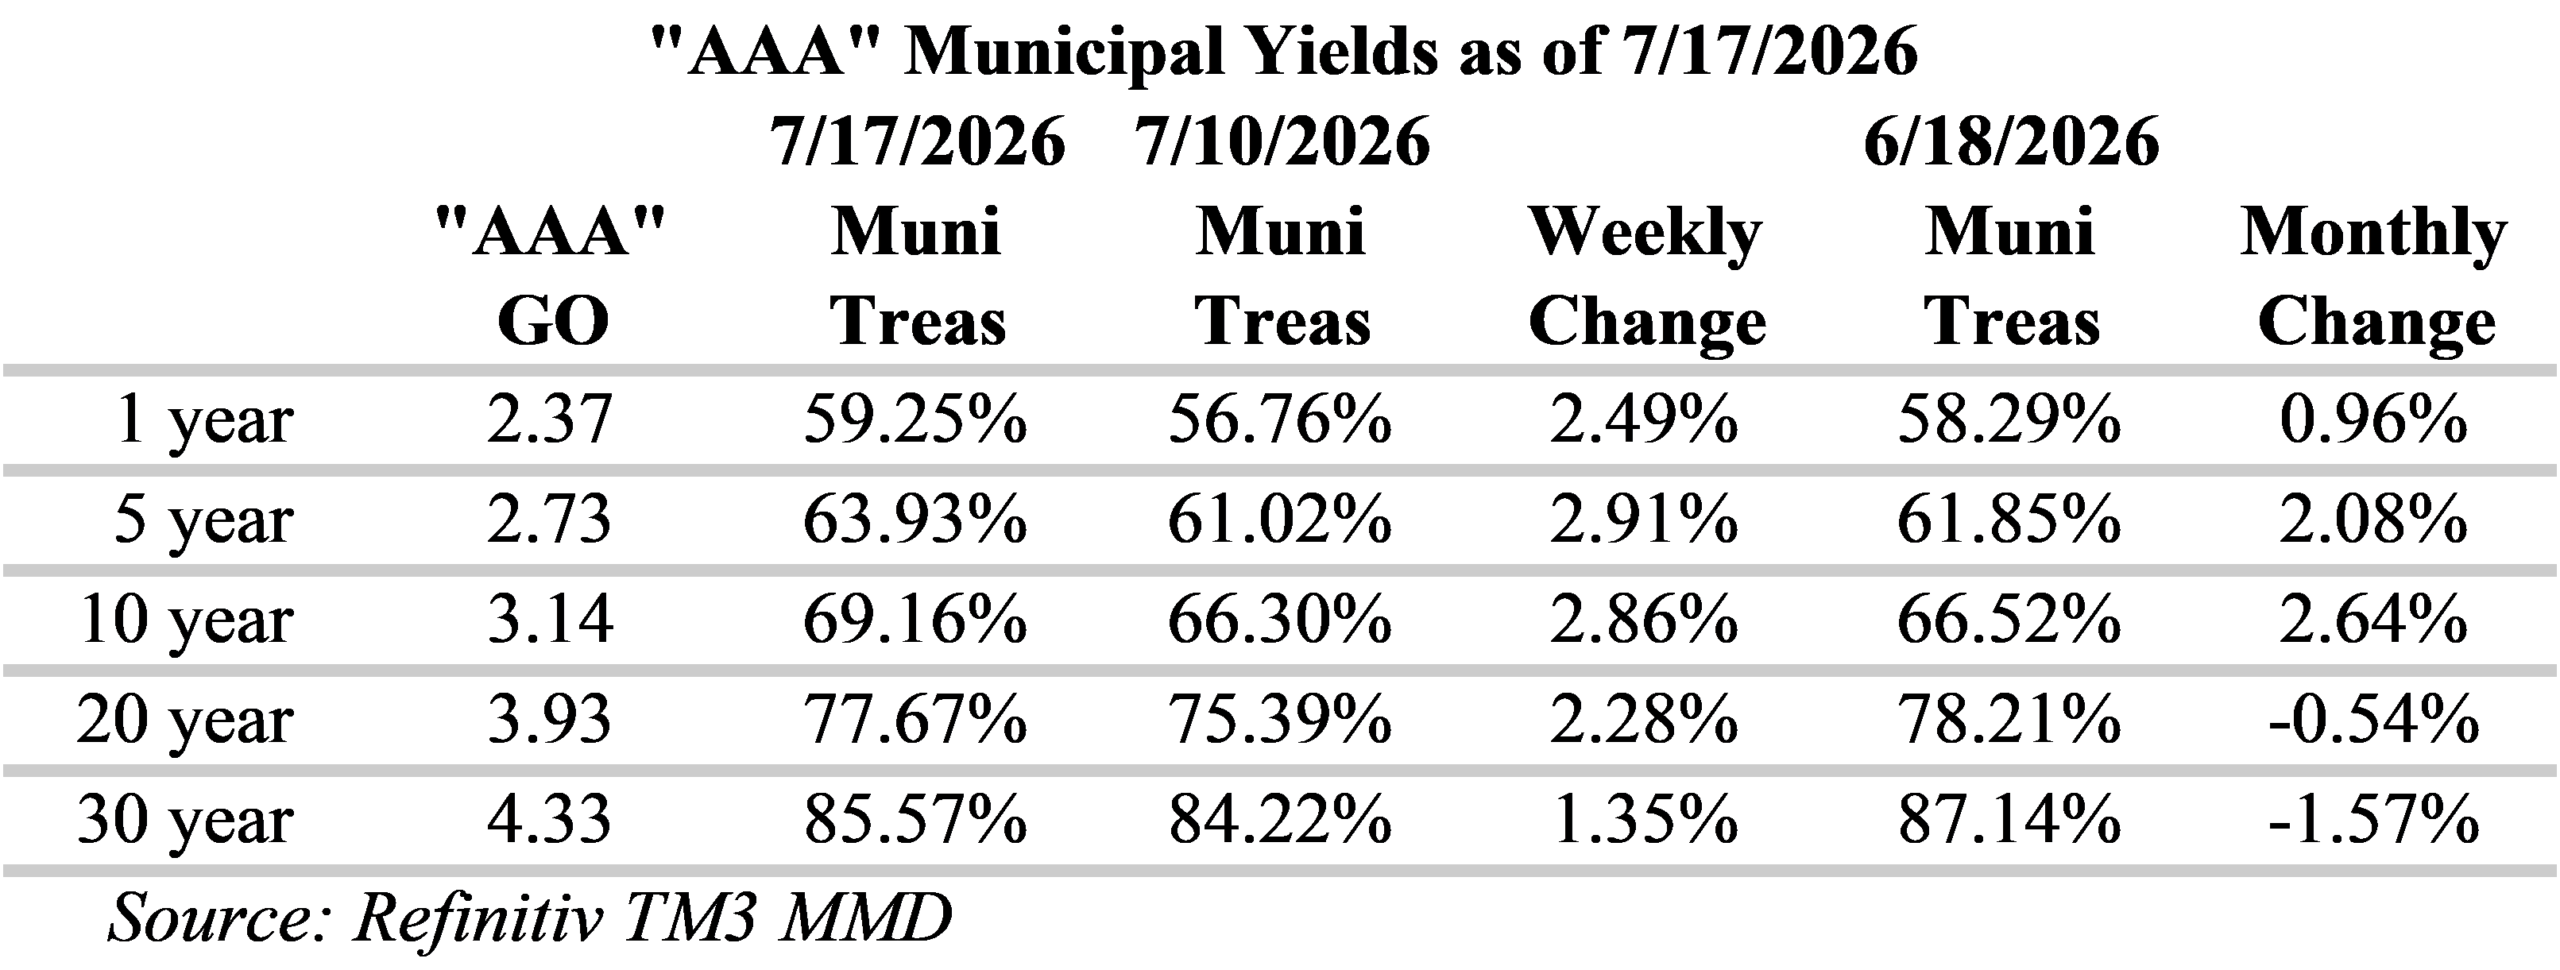
Over the past week, Municipal/Treasury ratios have generally increased (cheapened), although one-year ratios remain notably well below 60%. In recent weeks, ratios have fallen well below several important reference points along the curve. Ratios for 10-year municipal yields are now well under 70% of Treasuries, 20-year ratios are below 80% and 30-year ratios are below 90% of Treasuries. However, ratios have improved across the municipal yield curve over this past week, with the largest changes occurring from five to 10 years. For investors seeking to maximize curve positioning with relative value, the 19 to 21-year part of the municipal yield curve is attractive with slopes of 10 to 13-bps per year and yields around 80% of Treasuries. Although ratios past 20-years are more attractive, relative to Treasuries, the yield curve is very flat over these longer tenors.
The Municipal the new issue calendar remains elevated this week with US state and local governments expected to sell around $11.2 billion of bonds. Notable deals include: the New York City Transitional Finance Authority with $1.5 billion, the City of San Antonio Airport has $943.9 million, and West Valley-Mission Community College District is expected to bring $497 million to the market. Last week, municipal bond investors added approximately $1.4 billion to municipal-bond funds, according to LSEG Lipper Global Fund Flows. Overall, investors continue to support munis, but new issue pricings remain in focus.
Herbert J. Sims & Co. Inc. is a SEC registered broker-dealer, a member of FINRA, SIPC. The information contained herein has been prepared based upon publicly available sources believed to be reliable; however, HJ Sims does not warrant its completeness or accuracy and no independent verification has been made as to its accuracy or completeness. The information contained has been prepared and is distributed solely for informational purposes and is not a solicitation or an offer to buy or sell any security or instrument or to participate in any trading or investment strategy, and is subject to change without notice. All investments include risks. Nothing in this message or report constitutes or should be construed to be accounting, tax, investment or legal advice.