Overview
This morning, Treasury bonds sold-off amid surging oil prices as inflation fears drove yields higher. As conflict in the Middle East escalates, disruption in tanker activity and supply concerns will remain in-focus. Typically global conflict will place downward pressure on rates as investors seek safety; however, in a market already sensitive to inflation and the potential for further rate cuts oil driven inflation concerns have unsettled investors.
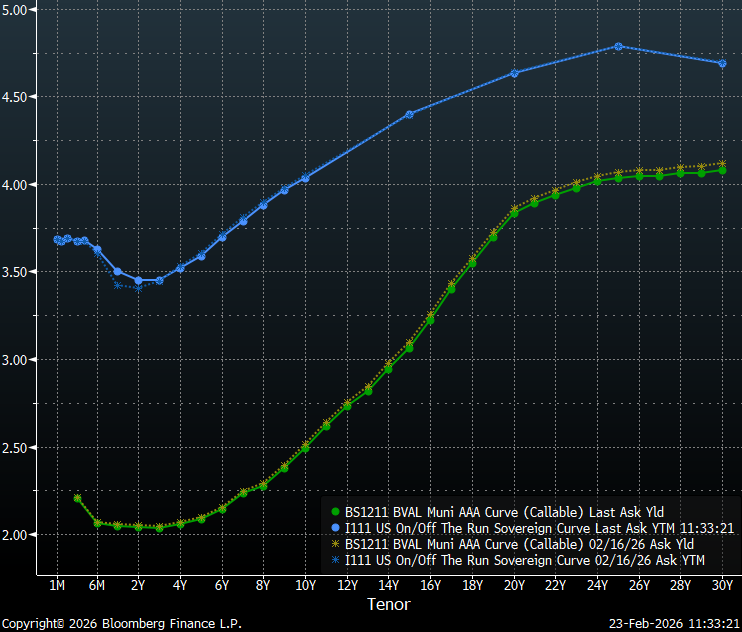
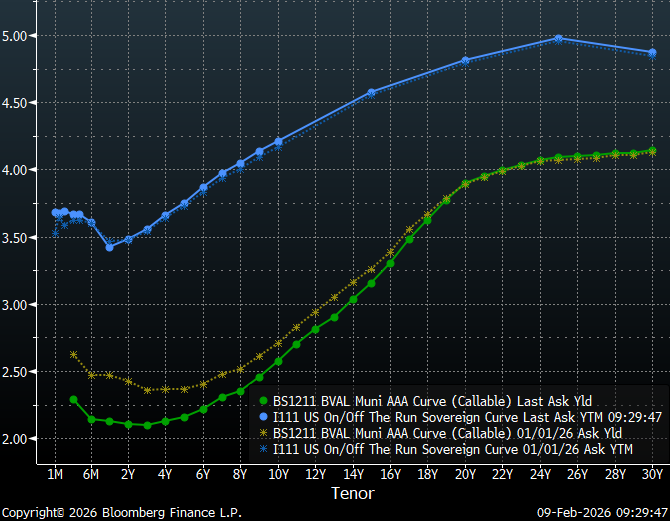
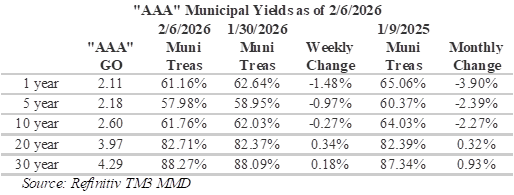
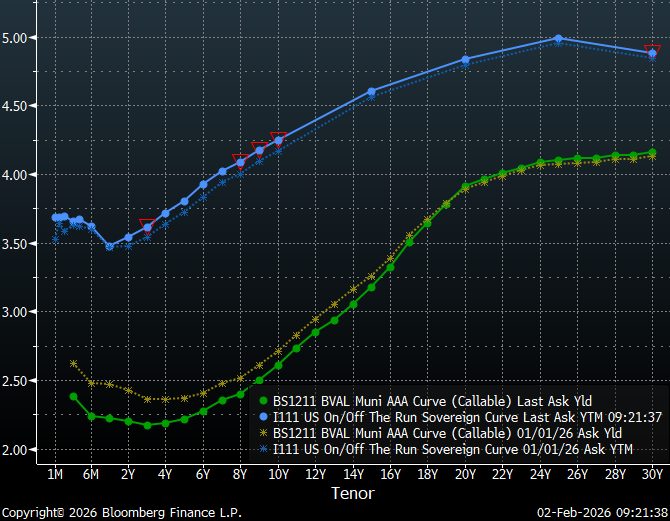
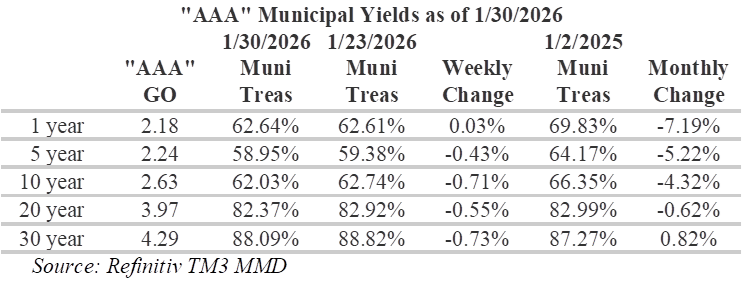
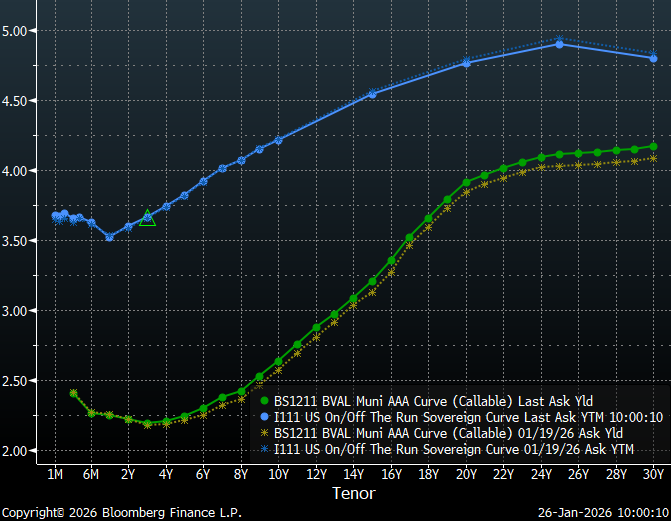
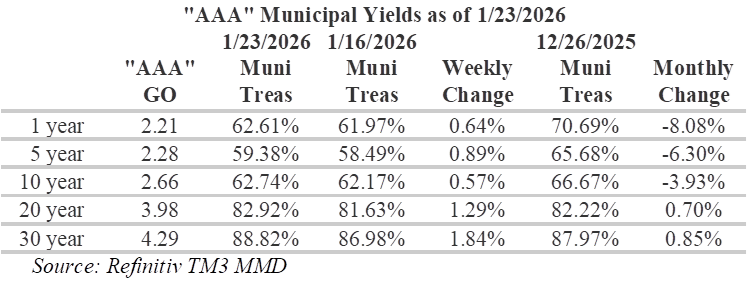
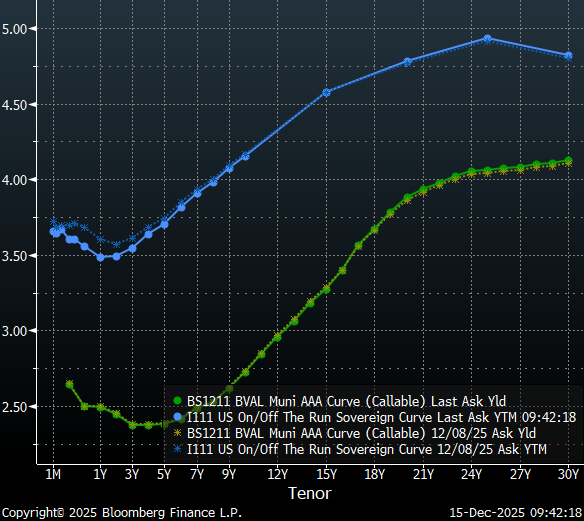
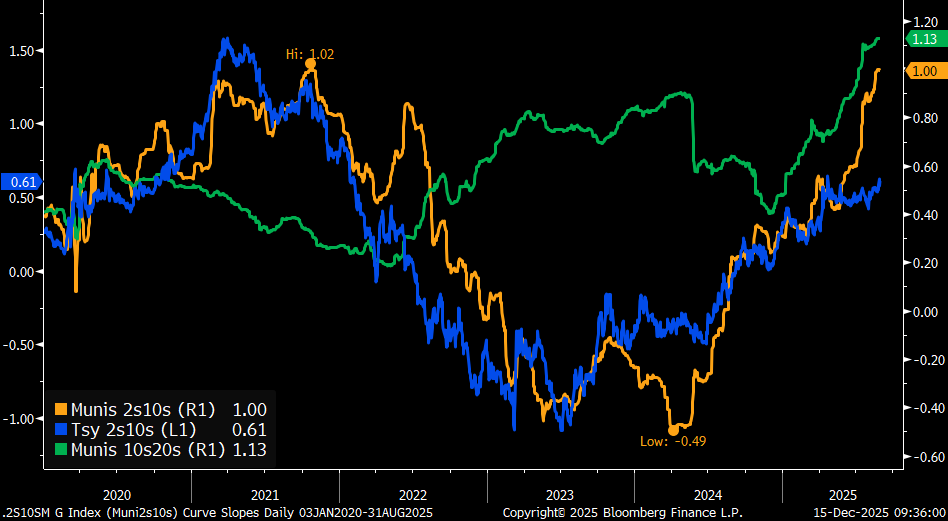
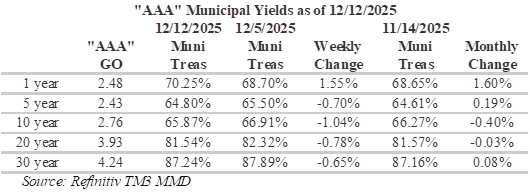
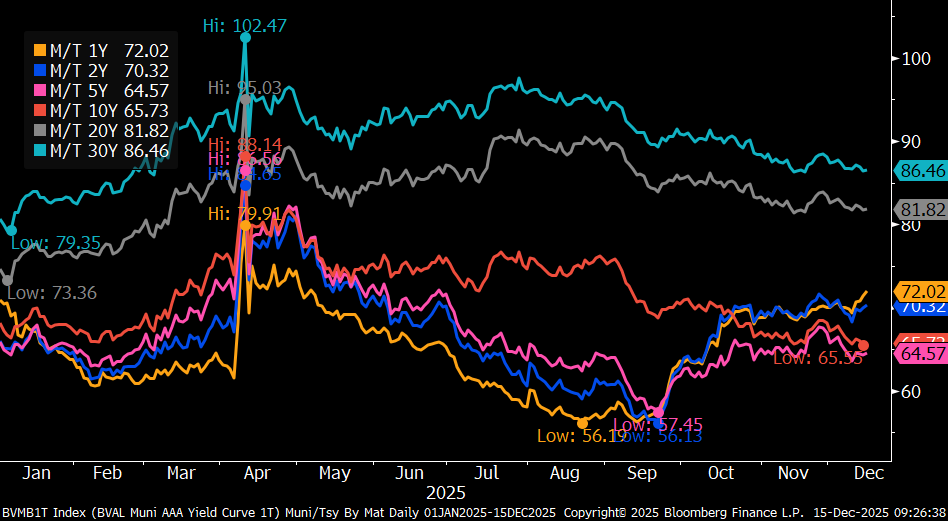
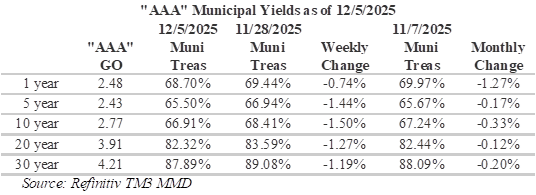
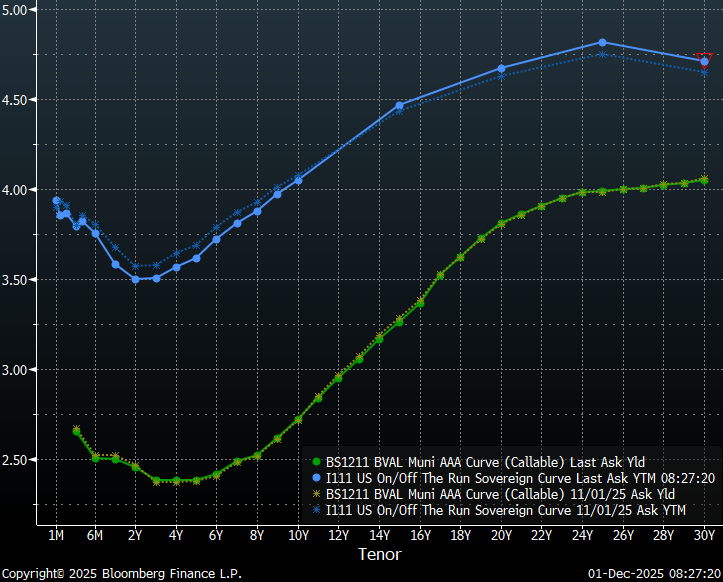
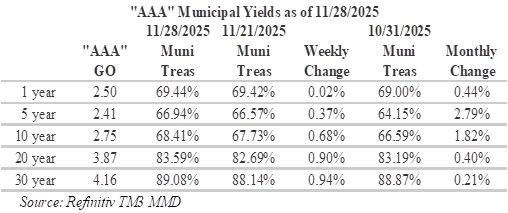
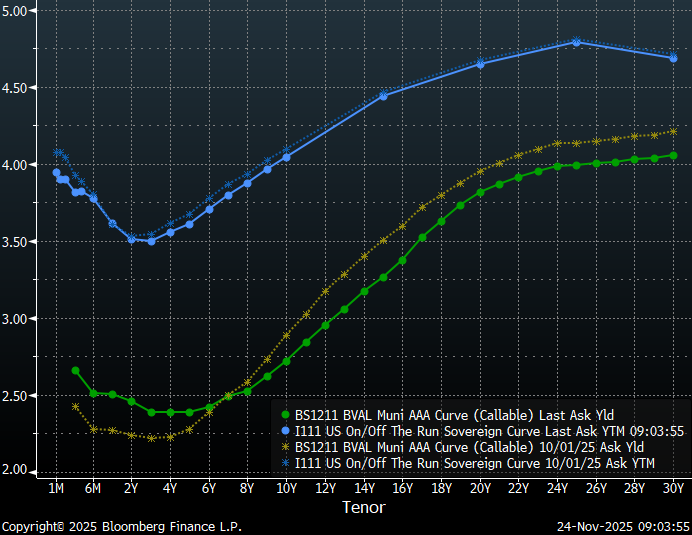
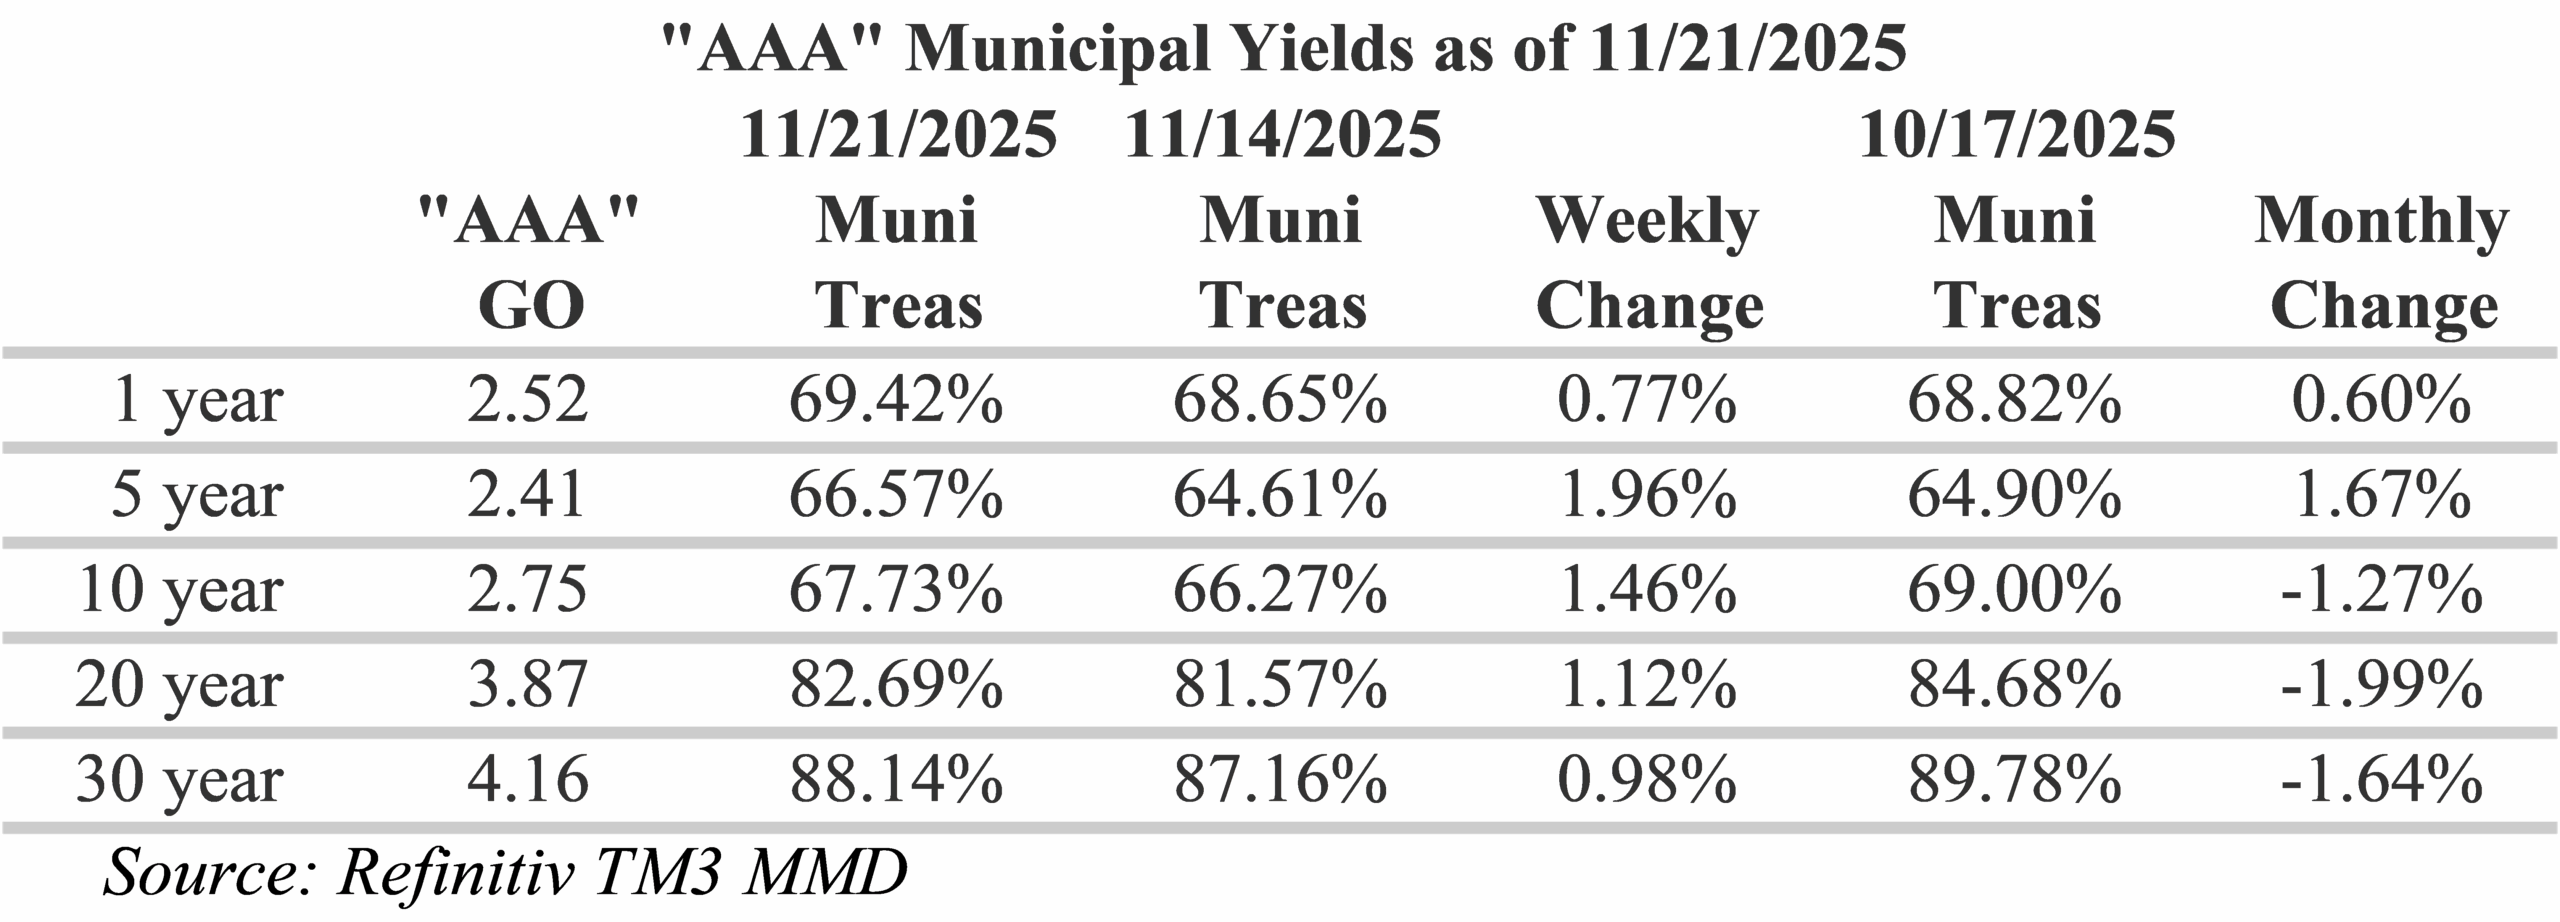
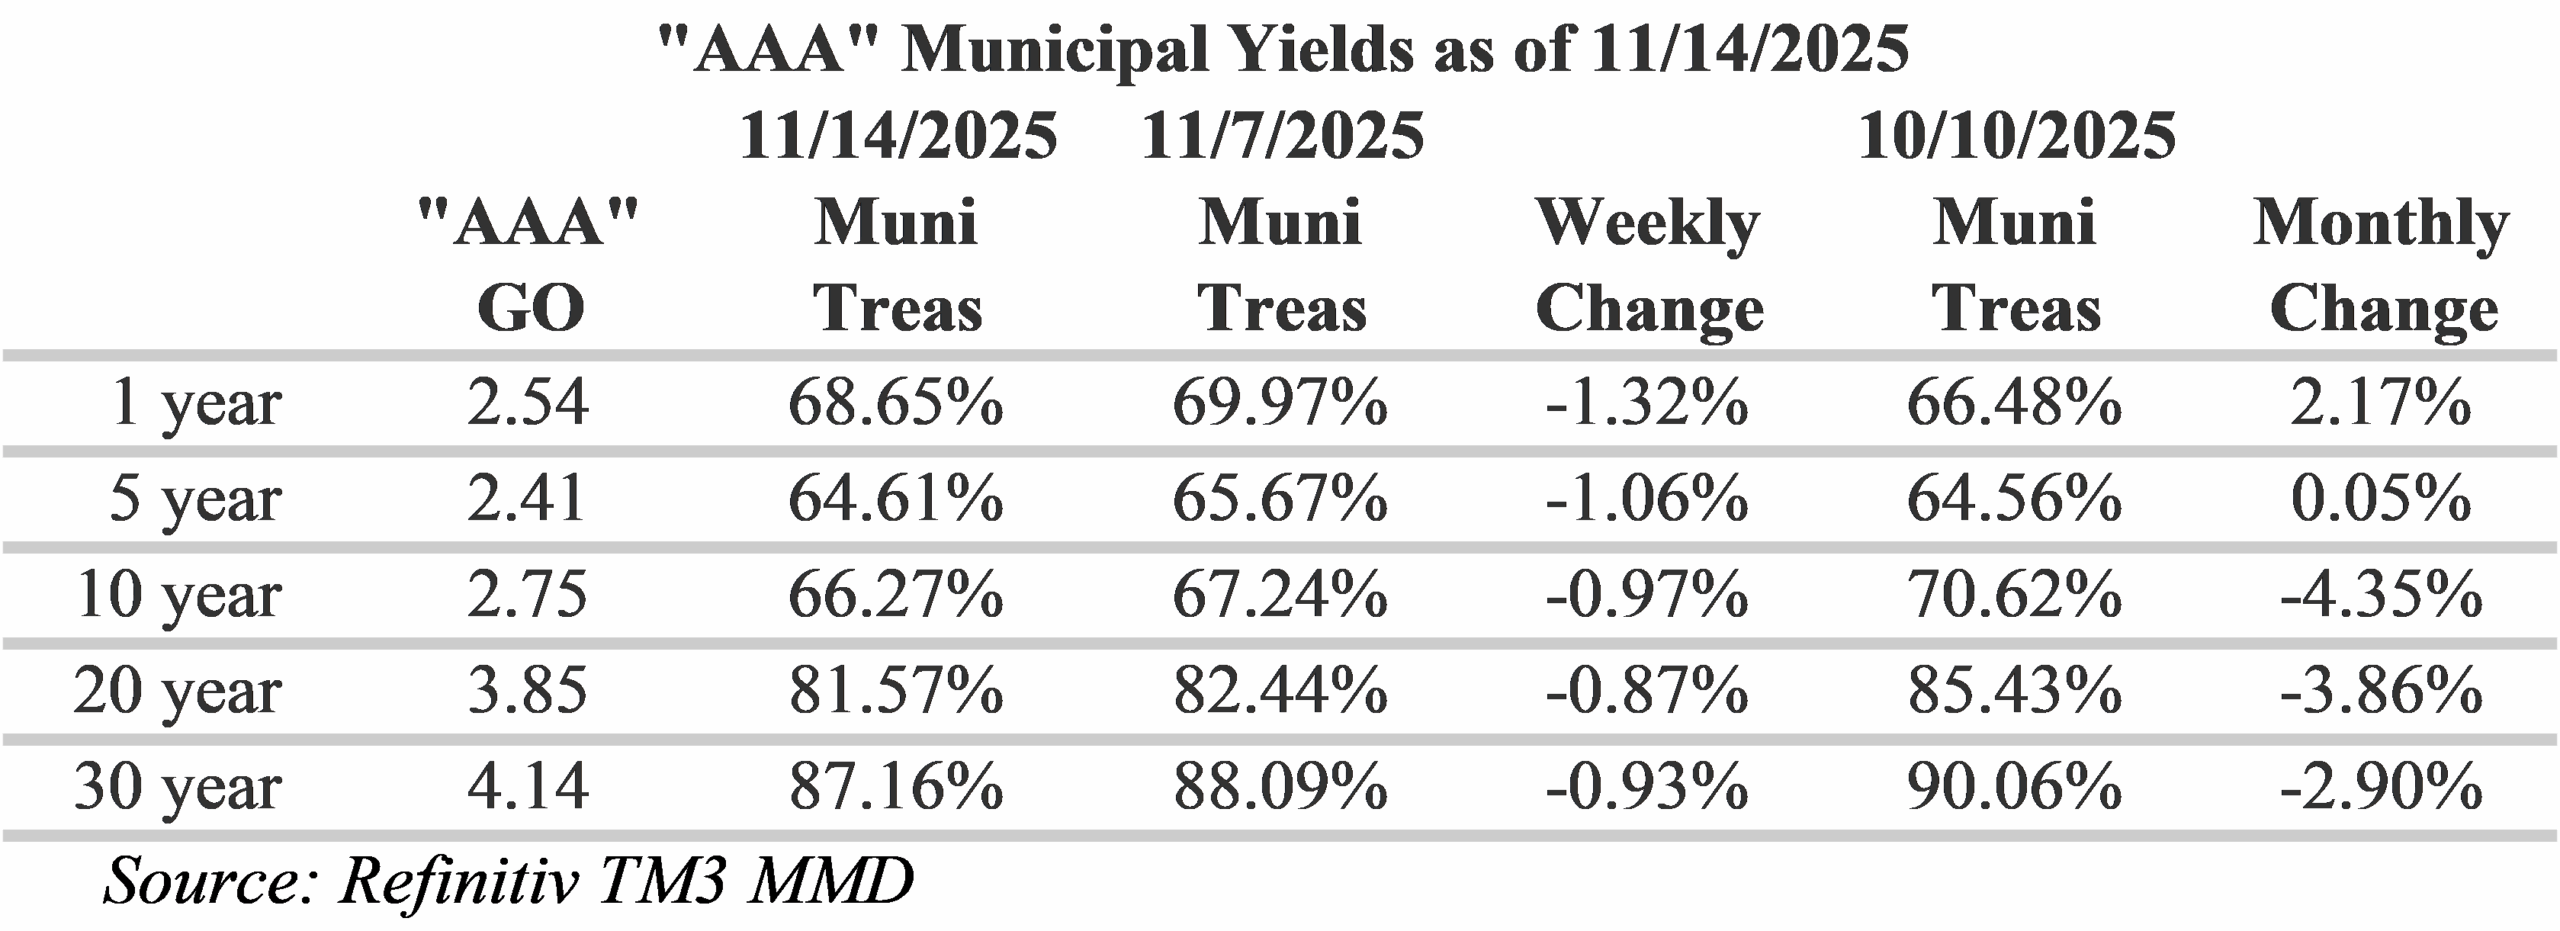
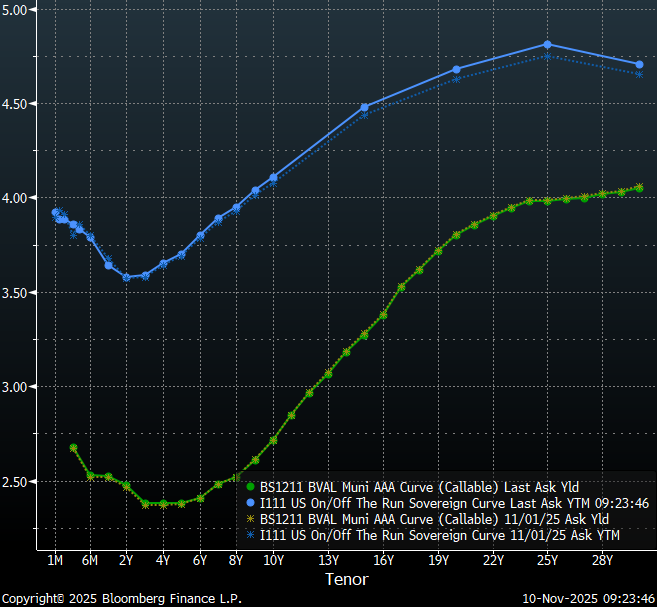
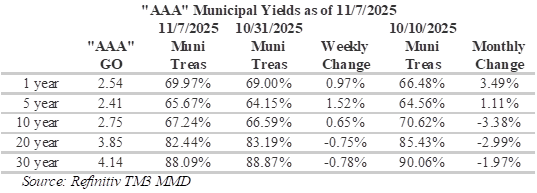
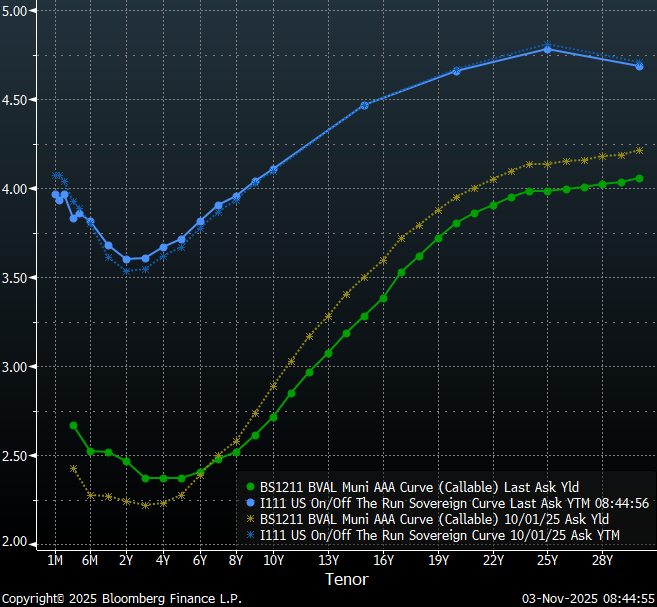
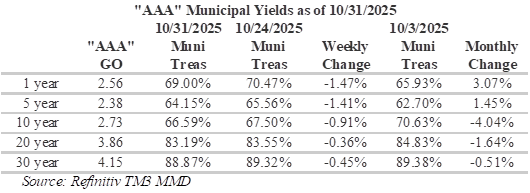
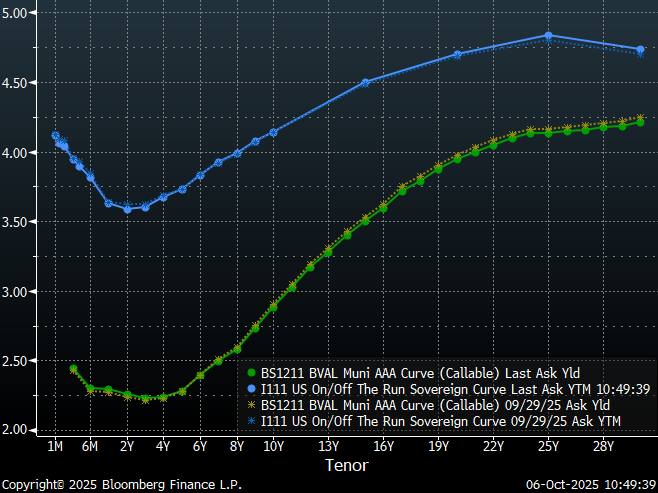
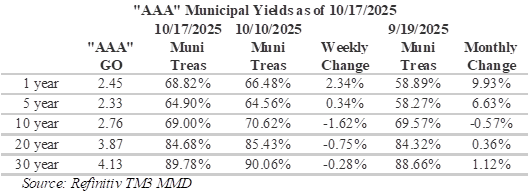
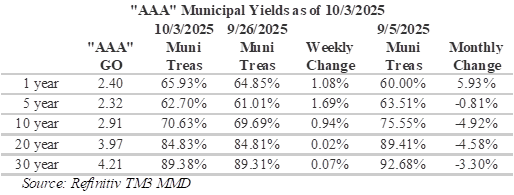
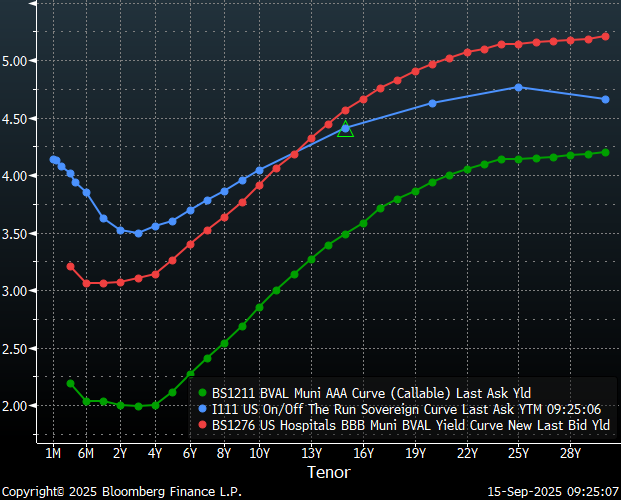
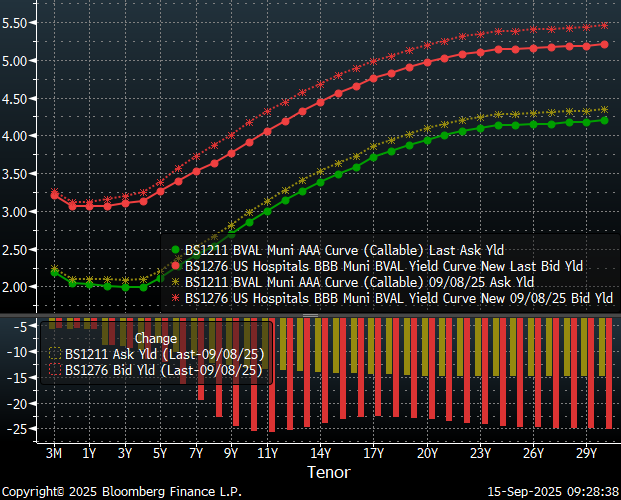
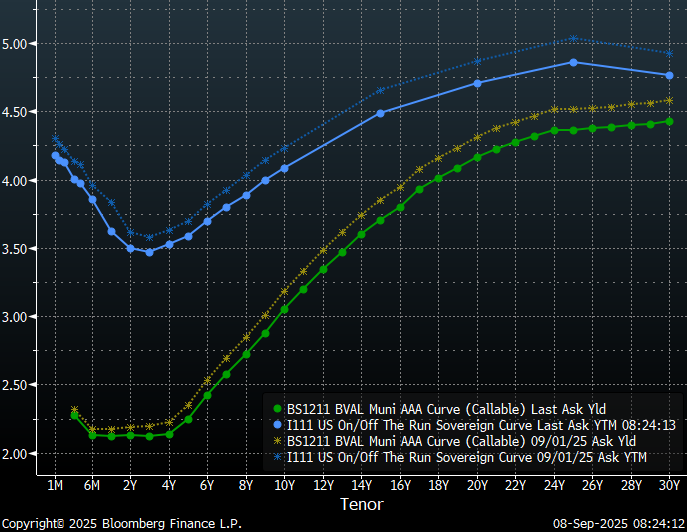
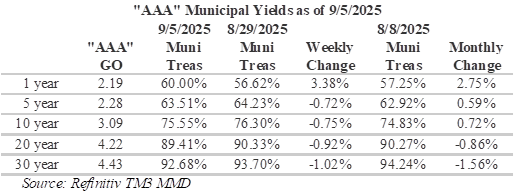
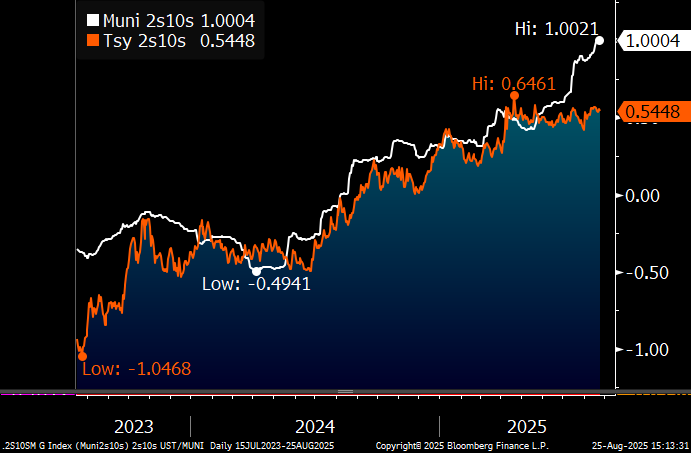
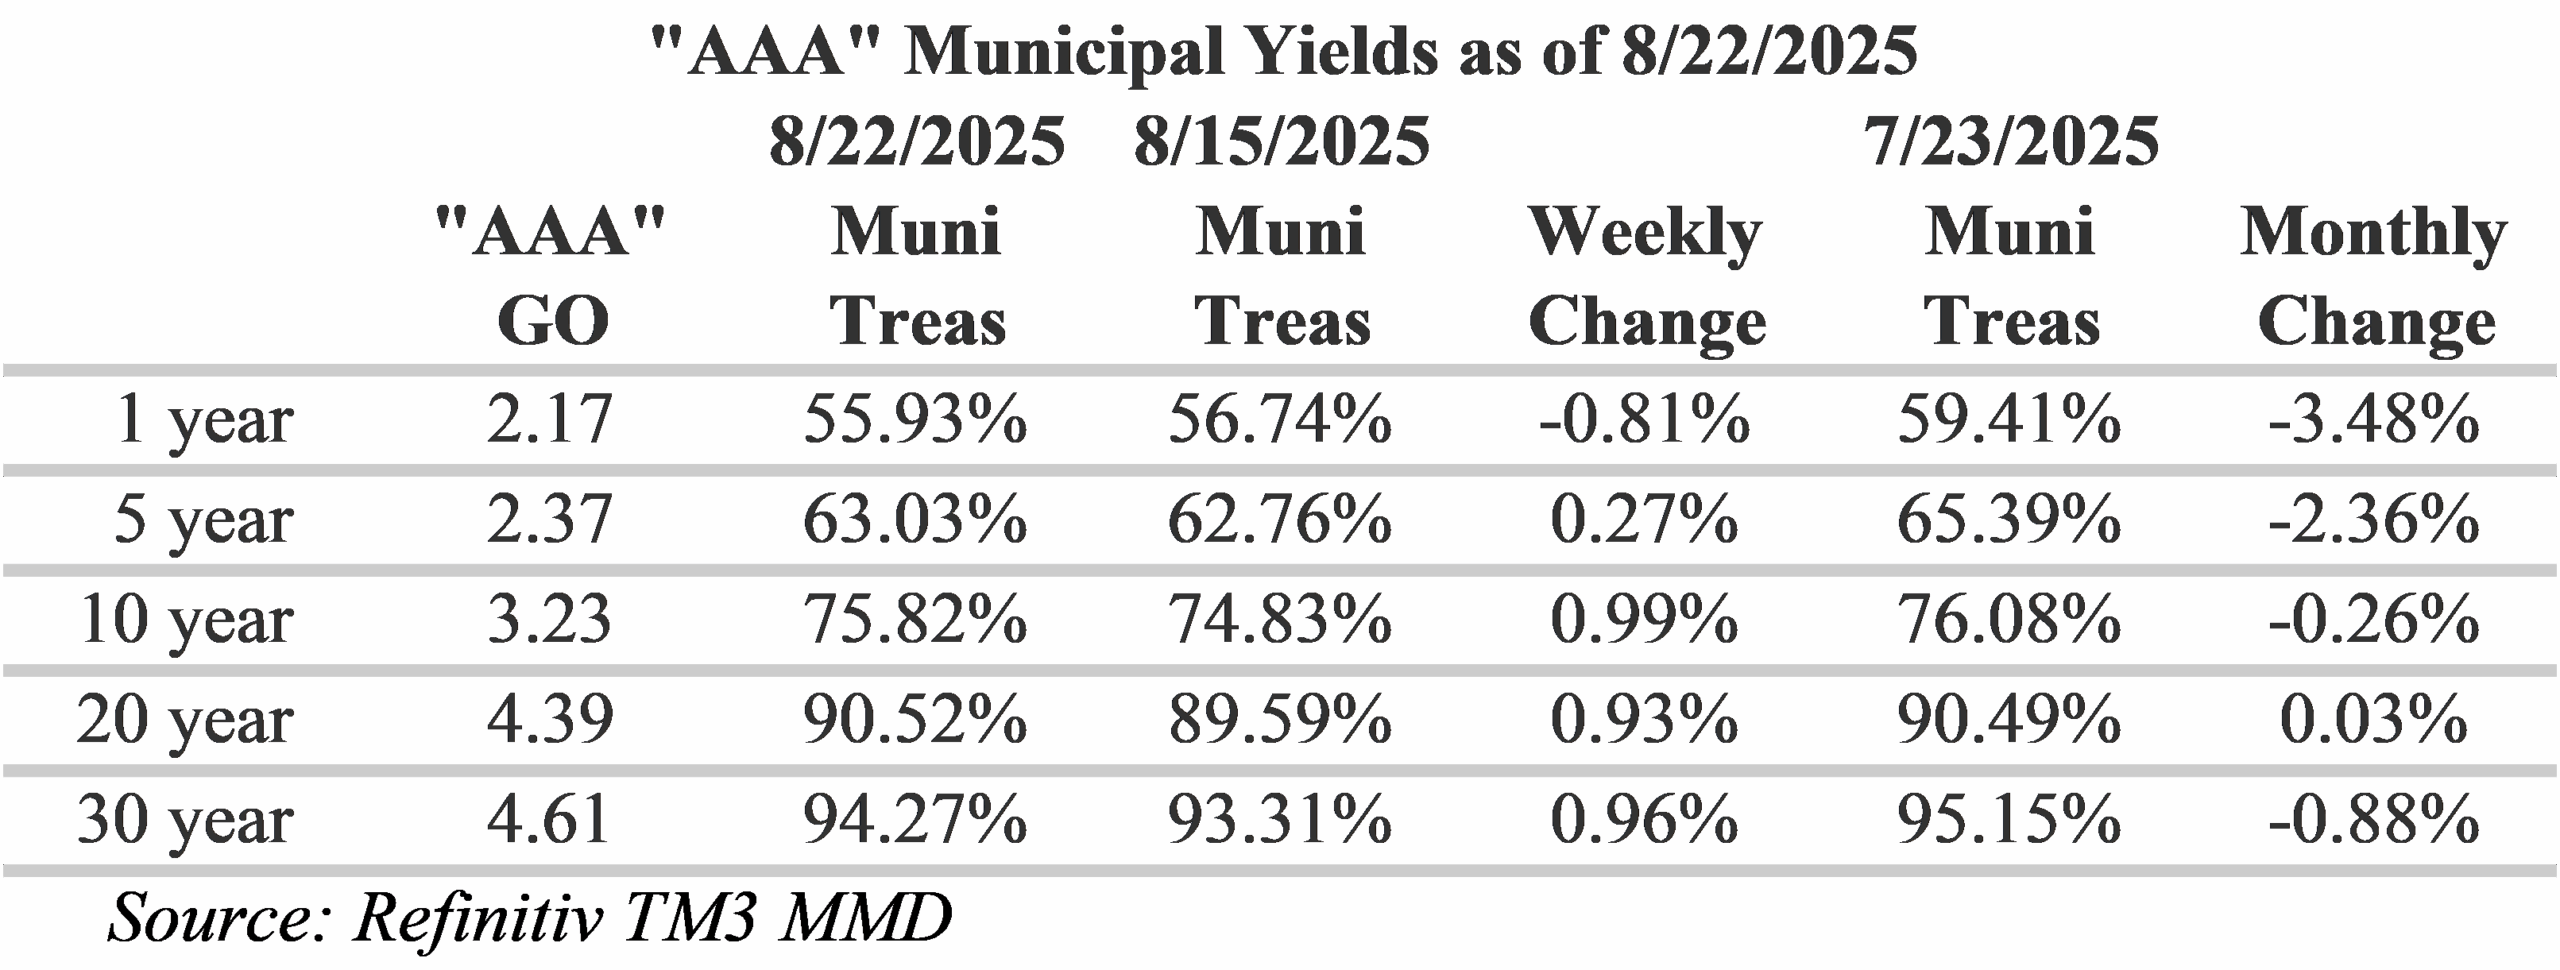
Trading in munis has been muted today, with investors cautiously waiting for additional information. Over the past month munis have generally lagged the rally in Treasuries, particularly for tenors past 2-years. The result has been a Treasury curve that has flattened about 18 bps while the muni curve steepened by about 6 bps. Recent activity is the continuation of a long-term trend in muni/Treasury ratios with ratios at the extreme short-end becoming more rich (less appealing) and ratios on the long-end becoming cheaper (more appealing). Currently, ratios for maturities shorter than 1-year are yielding 58.5% of their Treasury equivalents while 30-year munis are yielding over 90% of equivalent Treasuries.
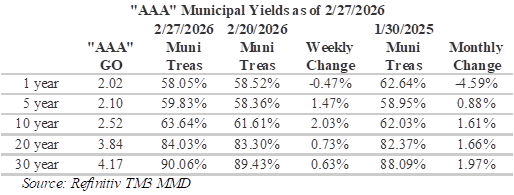
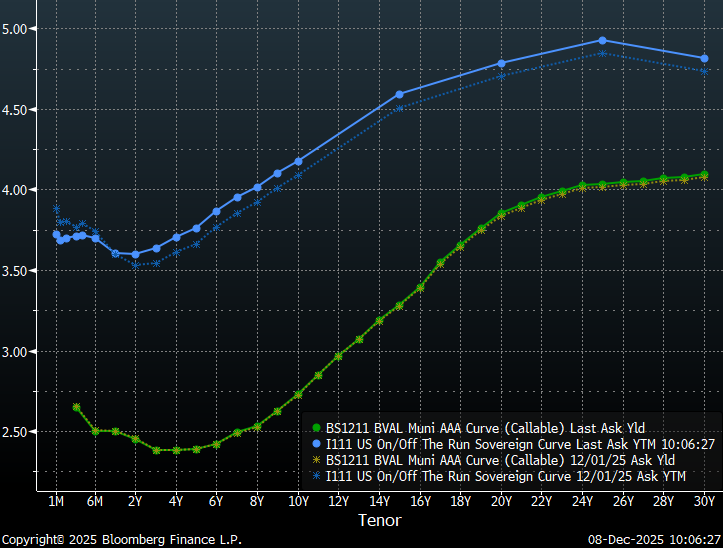
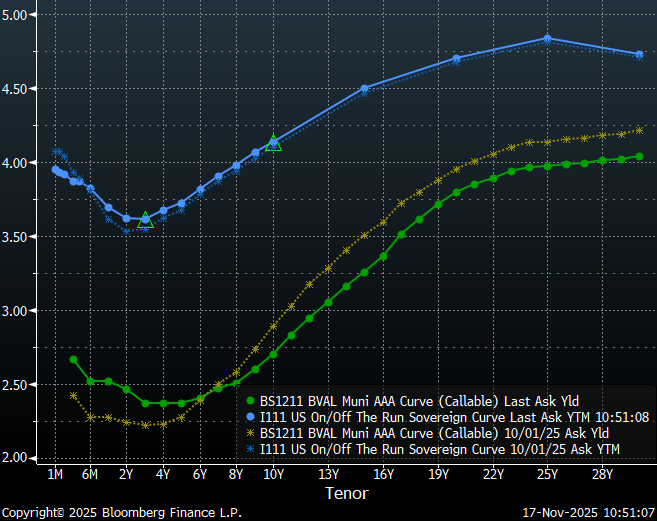
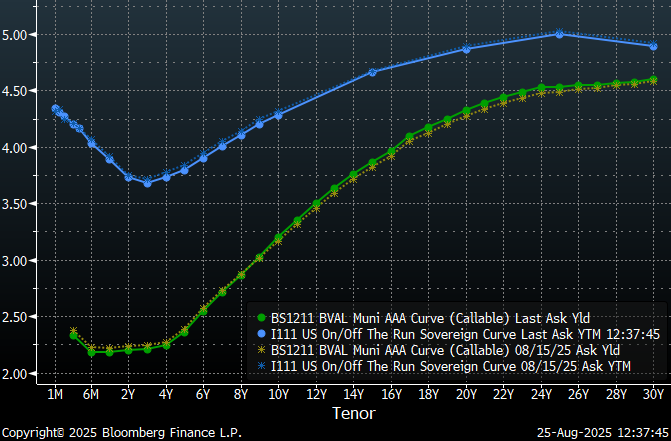
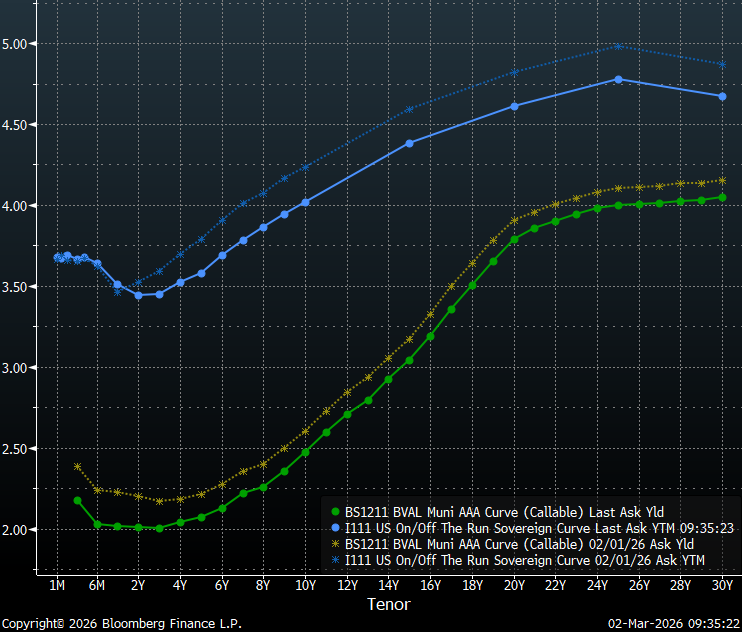
Slopes along the municipal yield curve continue to reward extending duration. Investors are incented to move longer out the yield curve by appealingly steep yields in the 10-20 year range, with a slope of 132 bps, versus only 50 bps from 1-10 years. Currently, the steepest slopes on the municipal curve are available from 15 to 20-years, where investors can pick-up approximately 74 bps. However, caution is advised for tenors past 20-years, where there is only 33 bps to be gained by extending out the remaining 10-years.
Insights and Strategy
Investors positioning in the longer intermediate portion of the curve benefit from a steep roll-down over time. In addition, due to flat long-term rates, municipal bond investors can currently buy maturities under 20-years that yield almost 90% of the 30-year curve. With muni/Treasury ratios for 10-year and shorter maturities quite rich at under 60%, extending maturities further out the curve have the added benefit of more appealing relative yields. Ratios in 20-year and longer maturities remain attractive, relative to Treasuries, due to seasonal activity and wider spreads. However, the yield curve remains very flat over these longer tenors. For investors seeking to maximize curve positioning with relative value, the 17 to 20-year part of the municipal yield curve has become very tempting with slopes of 15 to 16-bps per year.
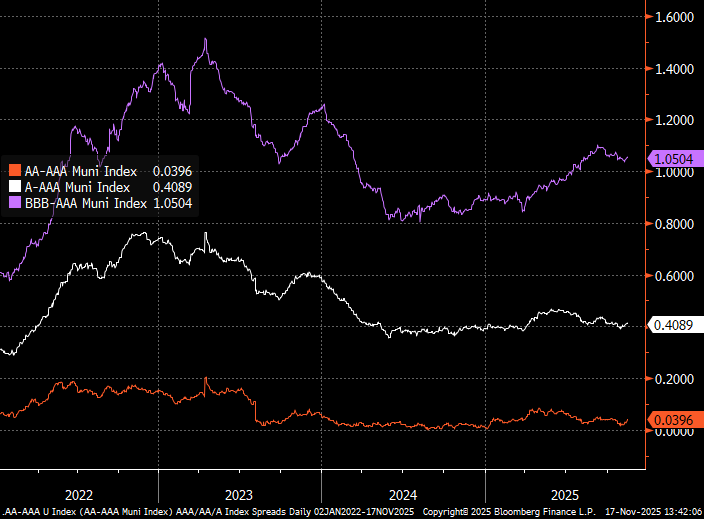
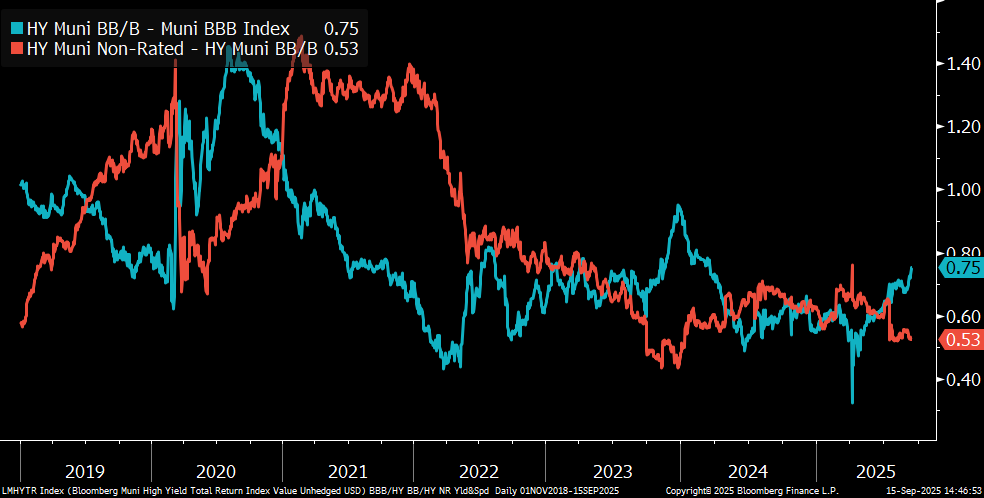
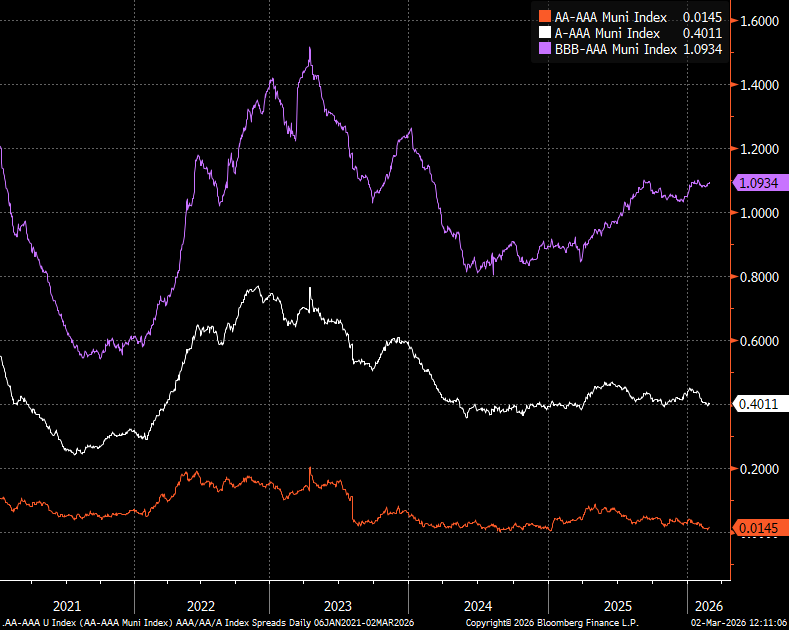
Credit risk continues to be rewarded, with ‘BBB’ credit spreads generally widening in 2026. However, ‘A’ and ‘AA’ credit spreads have been tightening due to reduced risk appetite as investors move into higher rated sectors and credits amid global and economic uncertainty. While selective assumption of risk continues to be rewarded for lower investment grade and high-yield credits, investors considering assuming credit risk should be cautious due to the potential for credit spread widening.
The municipal new issue calendar expands this week to $11.8 billion of new issues. Notable issues include: the City of Houston, TX, which plans to sell $1.43 billion in hotel occupancy tax & special revenue bonds, Arizona Transportation Board is scheduled to sell $786.3 million, and Lamar Consolidated Independent School Board is expected to sell a $545 million issue. This week’s deals should see a strong reception following 14 consecutive weeks of inflows, with approximately $1 billion being added to municipal bond funds last week, according to LSEG Lipper Global Fund Flows. Considering current muni/Treasury ratios, it is not surprising that the majority of inflows are going to intermediate and long-term muni funds.
Herbert J. Sims & Co. Inc. is a SEC registered broker-dealer, a member of FINRA, SIPC. The information contained herein has been prepared based upon publicly available sources believed to be reliable; however, HJ Sims does not warrant its completeness or accuracy and no independent verification has been made as to its accuracy or completeness. The information contained has been prepared and is distributed solely for informational purposes and is not a solicitation or an offer to buy or sell any security or instrument or to participate in any trading or investment strategy, and is subject to change without notice. All investments include risks. Nothing in this message or report constitutes or should be construed to be accounting, tax, investment or legal advice.