

Our team of market analysts have a singular mission: to help you make better investment decisions. Read the latest market commentary.
Continue readingOur team of market analysts have a singular mission: to help you make better investment decisions. Read the latest market commentary.
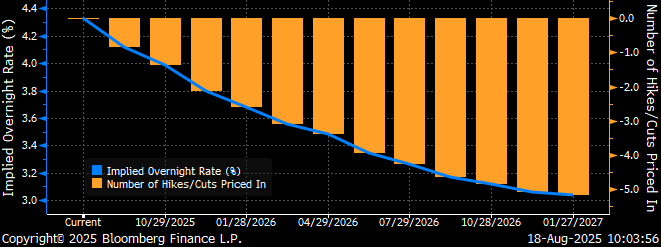
Continue readingInflation comes into a closer focus today in the Treasury market with Fed Funds Futures now reflecting an 84% chance of the Fed cutting rates next month. This is down significantly from last week when the probability was over 100%. Last week, the credit markets continued to focus on the August 1st Bureau of Labor Statistics nonfarm payrolls report, which included a cumulative downward adjustment of 258,000 jobs and convinced capital markets that a September rate cut was certain. However, the release of last week’s Producer Price Index, which jumped 0.9% on the month, compared with the Dow Jones estimate for a 0.2% gain, has markets casting doubt. Although the jobs data was striking, last week’s PPI is the biggest monthly increase we have seen since June 2022 and has the markets re-calibrating expectations.
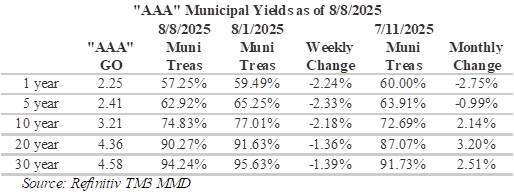
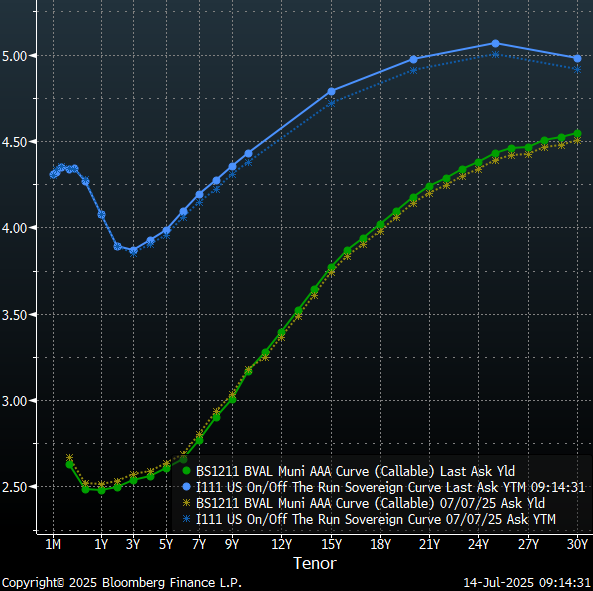
The municipal yield curve steepened a little over the past week with long maturities trending higher and maturities within 5-years rallying a bit. Treasuries also steepened over this past week, with the market selling-off as much as 8.5bpps on the long-end. On the trade desk, we continue to see aggressive bidding on the short-end with buyers continuing to anticipate a September Fed rate cut. Investors seeking optimal placement in the intermediate portion of the yield curve will be lured out to the 10-12-year tenor with relatively steep slopes and appealing yields versus the long-end of the curve. Currently the municipal curve has 52bps of slope from 2033 to 2036 with the 2036-year maturity yielding 74% of the 30-year curve. Extending an additional 7-years to the 20-year maturity brings yields to 95% of the 30-year curve. However, going much past this point marginal yields diminish to just 1- basis point per year for the last several years.
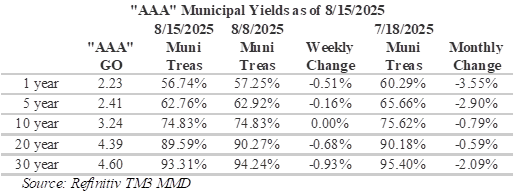
Although long-term ratios remain appealing, the yield differentials between municipals and Treasuries have once again richened over the past week. Despite the PPI recent print, muni/ Treasury ratios at the short-end of the curve continue to compress in anticipation of a September rate cut. Currently, levels are now well into to 50’s, which is a level that narrowly appeals to individual investors in the top tax brackets. While the markets have priced-in a September rate cut, the Fed remains concerned about tariff fueled inflation and sees its current policy stance as an appropriate guard against inflation. Ratios on the long-end remain relatively cheap with 20-year ratios approximately 90%.
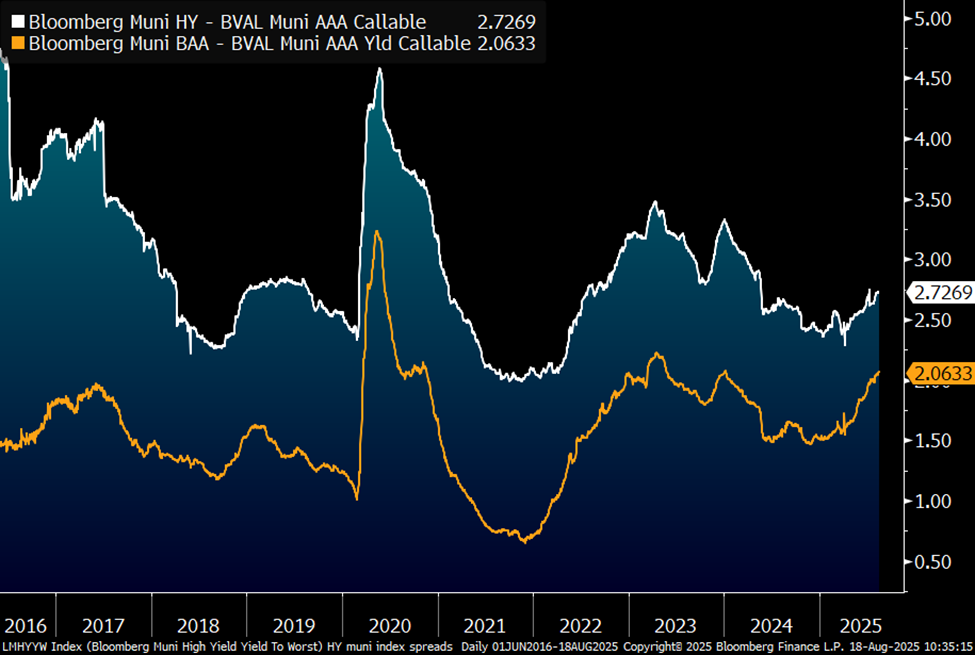
Credit spreads have been widening in the lower investment grade and non-rated sectors. Although economic concerns are weighing on the lower end of the credit spectrum, recent issuance has included several notably large non-rated and low-rated deals satisfying inquiries. Last week Florida’s Brightline private railroad rolled-over $985 million of junior debt at a yield of 14.89%. Low ridership and lagging revenue projections lead to S&P dropping its rating for some of the bonds issued on behalf of Brightline two steps to ‘BB-‘ from ‘BB+’ and Fitch lowering the senior debt to ‘B’ from ‘BB+’ at the end of last month. Recent ‘Baa’ credit spreads have widened to over 200 basis points, a 50 bps increase from the beginning of the year, and the Bloomberg High Yield municipal bond index is over 270 basis points wider than ‘AAA’ equivalents, a 40bps increase from early April following Liberation Day.
Herbert J. Sims & Co. Inc. is a SEC registered broker-dealer, a member of FINRA, SIPC. The information contained herein has been prepared based upon publicly available sources believed to be reliable; however, HJ Sims does not warrant its completeness or accuracy and no independent verification has been made as to its accuracy or completeness. The information contained has been prepared and is distributed solely for informational purposes and is not a solicitation or an offer to buy or sell any security or instrument or to participate in any trading or investment strategy, and is subject to change without notice. All investments include risks. Nothing in this message or report constitutes or should be construed to be accounting, tax, investment or legal advice.
Our team of market analysts have a singular mission: to help you make better investment decisions. Read the latest market commentary.
Continue reading

HJ Sims is pleased to announce our 2025 Private Wealth Management Summit. The internal Summit will be hosted on October 27th through October 30th at The Omni Grove Park Inn & Spa in Asheville, NC. This year’s program will focus on alternative investments, an increasingly relevant area in private wealth management.
The Summit offers HJ Sims financial professionals the chance to connect, learn, and exchange insights through educational sessions, collaborative discussions, and shared experiences. Together, we aim to deepen industry expertise and strengthen our ability to serve clients at the highest level.
Let us know if you will be there! Fill out the following form to RSVP to the Summit. Please let us know your check-in & check-out dates if you will need a hotel room (Marketing will coordinate hotel rooms for all attendees – you will not need to book your own room).


The information contained herein is subject to change without notice. Under no circumstances shall this constitute an offer to sell or solicitation of an offer to buy. Investments involve risk including the possible loss of principal. HJ Sims is a member of FINRA and SIPC, and is not affiliated with The Omni Grove Park Inn & Spa, NexPoint, Eagle Point Securities, Skyway Capital Markets, Preferred Capital Securities, Leon Capital Group, or Stockbridge Capital Group.
The municipal yield curve steepened over the past week with a rally in the muni market driving yields down across the curve amid aggressive bidding on the short-end in anticipation of a September Fed rate cut. Inquiries on the trade desk continue to be concentrated within 10-years and maturities under 5-years are pricing at notably tight levels. Treasuries, in contrast, flattened over the past week with the market selling-off from 6-months to 30-years with yields rising with greater consequence on the short-end than the long-end. The August 1st Bureau of Labor Statistics nonfarm payrolls report continues to weigh on the markets with traders focusing on softer payrolls data as justification for the Fed to cut rates at its next meeting. In addition, the nomination of Council of Economic Advisers Chairman Stephen Miran to serve out the final few months of Adriana Kugler’s seat following her surprise resignation last week has been viewed by the markets as a potentially dovish development.
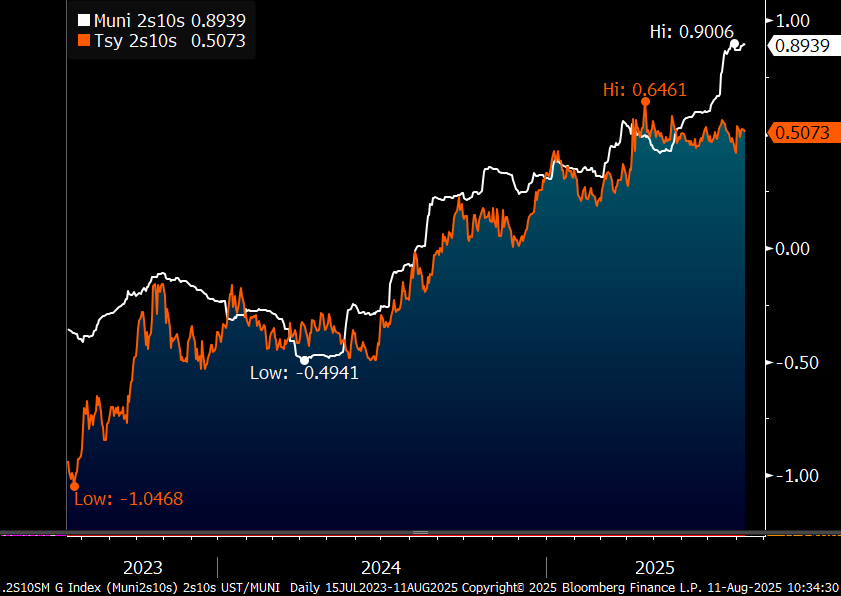
Today, the municipal yield curve continues to price to richer levels with bumps on the short-end as the long-end remains relatively cheap. Curve slopes in the more intermediate range continue to steepen with muni 2s10s continuing to steepen as the flattening treasury curve and steepening muni curve diverge. Recent movements highlight the uncorrelated nature of the two asset classes as a benefit of adding munis to fixed income portfolios. Investors seeking optimal placement in the intermediate portion of the yield curve will be lured out to the 11-13-year tenor with relatively appealing yields and steep slopes versus longer maturities. Currently the municipal curve has 80bps of slope from 8-13 years with the 13-year maturity yielding 80% of the 30-year curve. Extending an additional 7-years to the 20-year maturity brings yields to 95% of the 30-year curve. However, past this point marginal yields diminish to just 1- basis point per year for the last several years.
Although long-term ratios remain appealing, the yield differentials between municipals and Treasuries have richened over the past week. Muni/Treasury ratios at the short-end of the curve continue to compress in anticipation of a September rate cut. Currently, percentages are now well into to 50’s, which is a level that mainly appeals to individual investors in the top tax brackets. Although the markets have priced-in a September rate cut, the Fed has not been shy about concerns regarding tariff fueled inflation and sees its current policy stance as an appropriate guard against inflation. However, ratios on the long-end remain relatively cheap with 20-year ratios in the 90’s. Although risks and rewards need to carefully evaluated, the municipal yield curve is currently rewarding extension.
Last week, long-term municipal issue volumes hit $21.7 billion, which is the biggest weekly total since 2017, while steady inflows and a supportive interest-rate backdrop drove a modest rally. LSEG Lipper Global Fund Flows reported that over $2.6 billion have been added to municipal bond mutual funds over the last 2-weeks. This week municipal bond issuance is expected to be less than half of last week at $10.4 billion with $1.14 billion expected to be sold by the Port Authority of New York & New Jersey and $750 million from Long Island Power Authority. In addition, this week’s CPI data is facing heightened scrutiny by market participants following the removal of the US Bureau of Labor Statistics Commissioner earlier this month. This week’s CPI could prove pivotal amid anticipation that CPI shows inflation moving further away from the Fed’s 2% target.
Herbert J. Sims & Co. Inc. is a SEC registered broker-dealer, a member of FINRA, SIPC. The information contained herein has been prepared based upon publicly available sources believed to be reliable; however, HJ Sims does not warrant its completeness or accuracy and no independent verification has been made as to its accuracy or completeness. The information contained has been prepared and is distributed solely for informational purposes and is not a solicitation or an offer to buy or sell any security or instrument or to participate in any trading or investment strategy, and is subject to change without notice. All investments include risks. Nothing in this message or report constitutes or should be construed to be accounting, tax, investment or legal advice.
Our team of market analysts have a singular mission: to help you make better investment decisions. Read the latest market commentary.
Continue readingWith the August 1 tariff deadline, a full economic calendar and an FOMC meeting, last week was bound to be a dynamic week. However, it was Friday’s nonfarm payroll report that proved most impactful. Total nonfarm payrolls disappointed with little change reported in July with an additional 73,000 jobs, well below Dow Jones’ expectation of 100,000. Furthermore, the unemployment rate ticked up to 4.2% alongside another decrease in the labor force participation rate. However, the revisions to May and June were more impactful, with totals revised sharply lower, by a combined 258,000 jobs from previously announced levels. Markets subsequently repriced the policy outlook for the Fed’s next rate cut with the futures market pricing in the probability of a September rate hike over 90%. The news was promptly absorbed by the municipal yield curve without prejudice of maturity, with a 7 bps bump per year from 2026 to 2055, resulting in a parallel drop lower in yields. The Treasury market also responded with yields dropping, largely in the policy sensitive 2-year note, which fell as much as 28 bps.
Throughout the month of July, both the Treasury and municipal yield curves experienced meaningful steepening. Munis steepened more than Treasuries, largely due to yields falling on the short-end of the curve rather than yields climbing on the long-end. For the Treasury curve, the steepening was less pronounced as 30-year yields climbed only 2.5 bps and yields around the 1-year mark dropped a significant 16bps. Currently, the municipal curve is at its steepest around the 10-year tenor with 51 bps of slope from 8 to 11-years. In addition, after this past week, the curve has steepened notably around the 5-year tenor with 33 basis points of slope from 4 to 7-years. Overall, the steepness of both curves provides significant incentive for duration extension.
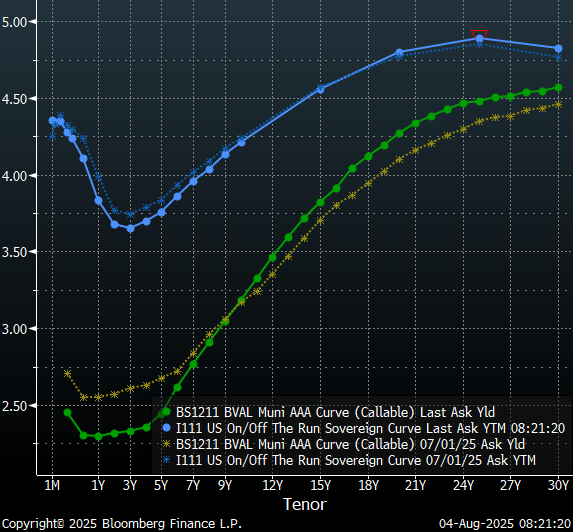
Over the past week, muni/Treasury ratios have generally cheapened, particularly around the 10-year tenor. Over the past month, ratios in the longer intermediate and on the long-end have cheapened with short to short intermediate ratios a bit richer. Over the past month, the biggest changes have occurred around the 20-year tenor, which has gone from being in the high 80’s to the low 90’s. Over the past week, the biggest changes have been around the 10-year tenor as ratios approach 80%. Overall, the 10-year and 20-year portions of the curve are strategically appealing with a combination of compelling ratios and yield curve slopes that reward extension. However, past this point the yield curve discourages extension by flattening to just a basis point or two per year. As a result, extending out to the 20-year maturity allows investors to capture over 95% of the 30-year municipal curve.

This week, the municipal bond calendar includes more than $17 billion in new issues, according to data compiled by Bloomberg. Large issues on the calendar include: the City of New York, NY, which plans to sell $1.78b of bonds, Brightline Florida Holdings LLC, which is scheduled to sell $985 million, and Beth Israel Lahey Health Obligated Group, which plans to offer $930 million. In addition, there are 34 school districts in Texas planning to sell bonds backed by the Texas Permanent School bond guarantee fund. This supply will likely be met with strong demand following last week’s addition of $937 million by municipal bond mutual funds, as reported by LSEG Lipper Global Fund Flows. In addition, municipal bond redemptions and maturities are expected to be $21.6 billion in the next 30-days.
Herbert J. Sims & Co. Inc. is a SEC registered broker-dealer, a member of FINRA, SIPC. The information contained herein has been prepared based upon publicly available sources believed to be reliable; however, HJ Sims does not warrant its completeness or accuracy and no independent verification has been made as to its accuracy or completeness. The information contained has been prepared and is distributed solely for informational purposes and is not a solicitation or an offer to buy or sell any security or instrument or to participate in any trading or investment strategy, and is subject to change without notice. All investments include risks. Nothing in this message or report constitutes or should be construed to be accounting, tax, investment or legal advice.
Our team of market analysts have a singular mission: to help you make better investment decisions. Read the latest market commentary.
Continue readingUS seasonally adjusted initial jobless claims dropped to 217,000 last week, which marks a 3-month low, supporting speculation the Federal Reserve will keep rates unchanged at this week’s meeting. Currently, the futures market is pricing-in only a 3% chance of a rate cut at this week’s meeting with the first cut of the year not anticipated until October. However, the job market may not be as robust as it initially appears. As noted during our Trader’s Strategic Ideas session earlier this month, continued jobless claims have been steadily increasing over the past 3-years, indicating jobless workers are taking longer to re-enter the labor force. Last week, continued claims increased to 2.039 million, an increase of 113,926 from the prior week and an extension of this longer-term trend. Following the Fed’s meeting later this week, we hope to have more clarity on the Fed’s assessment of recent employment and inflation data.
Municipal bonds outperformed Treasuries over the past week with both munis and Treasuries experiencing their largest moves in the 1 to 5-year portion of the yield curve, although in opposite directions. While munis rallied by as much as 7.5 basis points in the 4-year tenor, Treasuries sold-off by as much as 6.7 basis points in the 2-year tenor, flattening the overall Treasury curve. Maturities past 10-years are essentially unchanged for both curves. Muni investor sentiment continues to carry a cautious tone as investors target maturities under 5-years in an effort to shorten duration on bond portfolios amid uncertainty regarding future rates.
This divergence between munis and Treasuries has resulted in richer ratios on the front end, with the 5-year tenor falling to just over 65% and the 1-year ratio dropping below 60%. Ratios on the longer-end have cheapened with the biggest changes around the 20-year tenor, which is presently over 90%. Slopes along the municipal curve continue to steepen significantly past 5-years, with an overall slope of over 100 basis points from 6 to 12-years. The 20-year portion of the curve remains appealing on a relative value basis, with yields over 90% of equivalent Treasuries and almost 95% of the entire 30-year municipal curve. However, past this point the yield curve discourages extension by flattening to just a basis point or two per year.

In addition to the Fed announcement, the economic calendar is rather hefty this week with announcements expected for housing from Case-Shiller, JOLTS job openings, MBA mortgage applications, ADP employment change and PCE. We also have a hefty bond calendar, particularly for a Fed week, which includes approximately $12 billion in new supply. Notably, the Public Finance Authority is selling $3.5 billion in senior lien toll revenue bonds to fund the Georgia SR 400 Express Lanes Project. The Fed meeting combined with economic data and the expiration of the pause on tariffs will likely test demand.
Herbert J. Sims & Co. Inc. is a SEC registered broker-dealer, a member of FINRA, SIPC. The information contained herein has been prepared based upon publicly available sources believed to be reliable; however, HJ Sims does not warrant its completeness or accuracy and no independent verification has been made as to its accuracy or completeness. The information contained has been prepared and is distributed solely for informational purposes and is not a solicitation or an offer to buy or sell any security or instrument or to participate in any trading or investment strategy, and is subject to change without notice. All investments include risks. Nothing in this message or report constitutes or should be construed to be accounting, tax, investment or legal advice.
Our team of market analysts have a singular mission: to help you make better investment decisions. Read the latest market commentary.
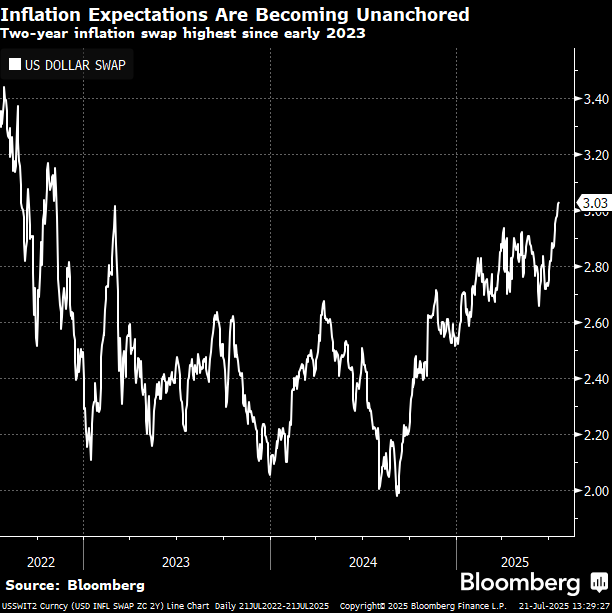
Continue readingTreasuries outperformed munis during this past week, as both markets moved in opposite directions on the long-end. Although uncertainty remains high, comments from Fed governor Waller supporting a July rate cut have put downward pressure on Treasury rates while the muni market struggles with: weakening fund demand, heavy supply and growing secondary offerings, particularly for maturities beyond the 10-year tenor. Looking at inflation expectations via inflation swaps, the market’s concerns become increasingly evident with two-year inflation swaps now over 3%, which is a level we haven’t seen since early 2023. In addition, with potentially higher tariffs being implemented on August 1, inflation anxiety is likely to be a significant factor this week.
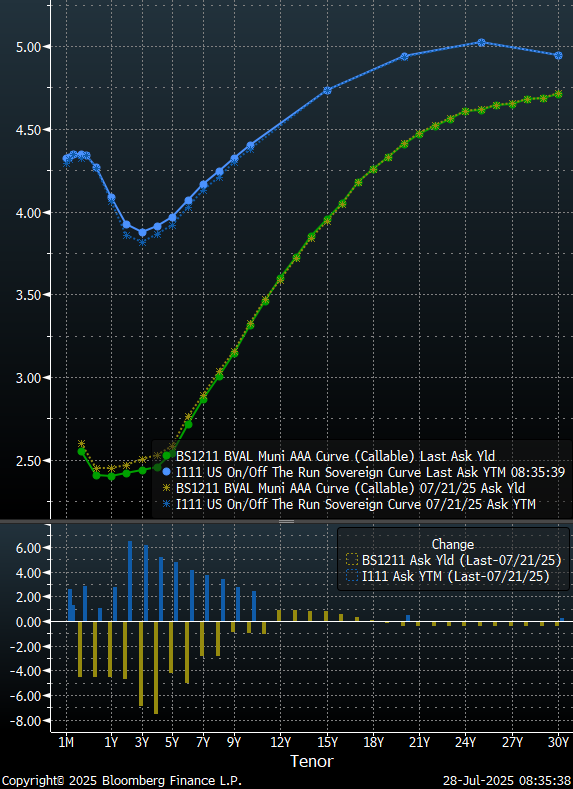
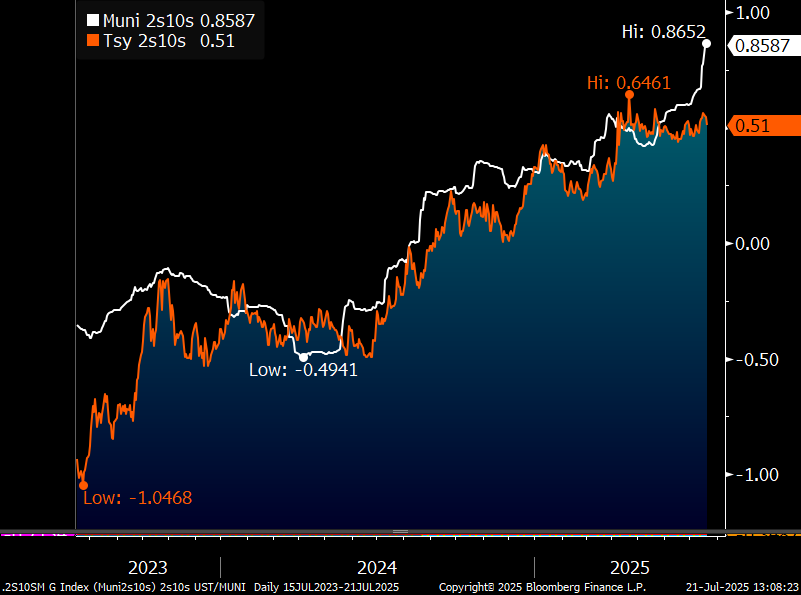
Over the past week, Treasury yields past 10-years have generally declined by approximately 5 basis points while shorter Treasury yields survived the week essentially unchanged, resulting in a flatter Treasury curve. The municipal yield curve, on the other hand, moved higher with continued strong issuance and diminishing institutional demand paving a path to higher yields by approximately 15 to 23 basis points for tenors past 10-years. Looking at the 2s10s spread, which is the difference between the 10-year yield and the 2-year yield as an indicator of the steepness of the yield curve, the municipal curve has recently reached the steepest slope in over 2-years. This is an invitation for bond investors to extend duration.
Slopes along the municipal curve continue to steepen significantly past 5-years, with an overall slope of 92 basis points from 6 to 11-years. Although the 20-year portion of the curve remains appealing on a relative value basis, with yields at 90% of equivalent Treasuries and almost 95% of the entire 30-year municipal curve. However, past this point the yield curve discourages extension by flattening to just a basis point or two per year.
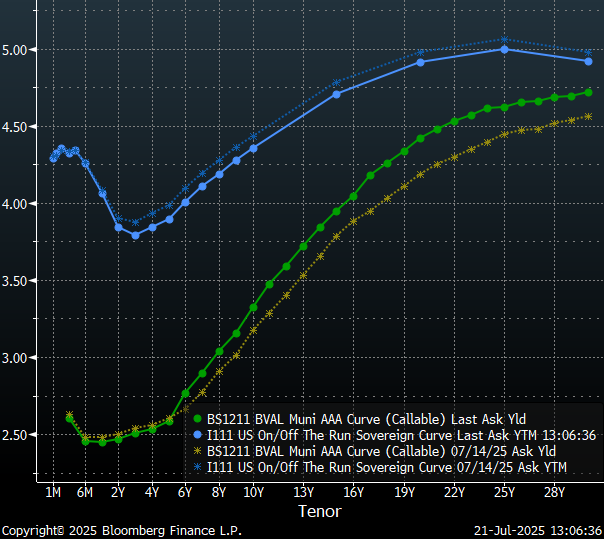
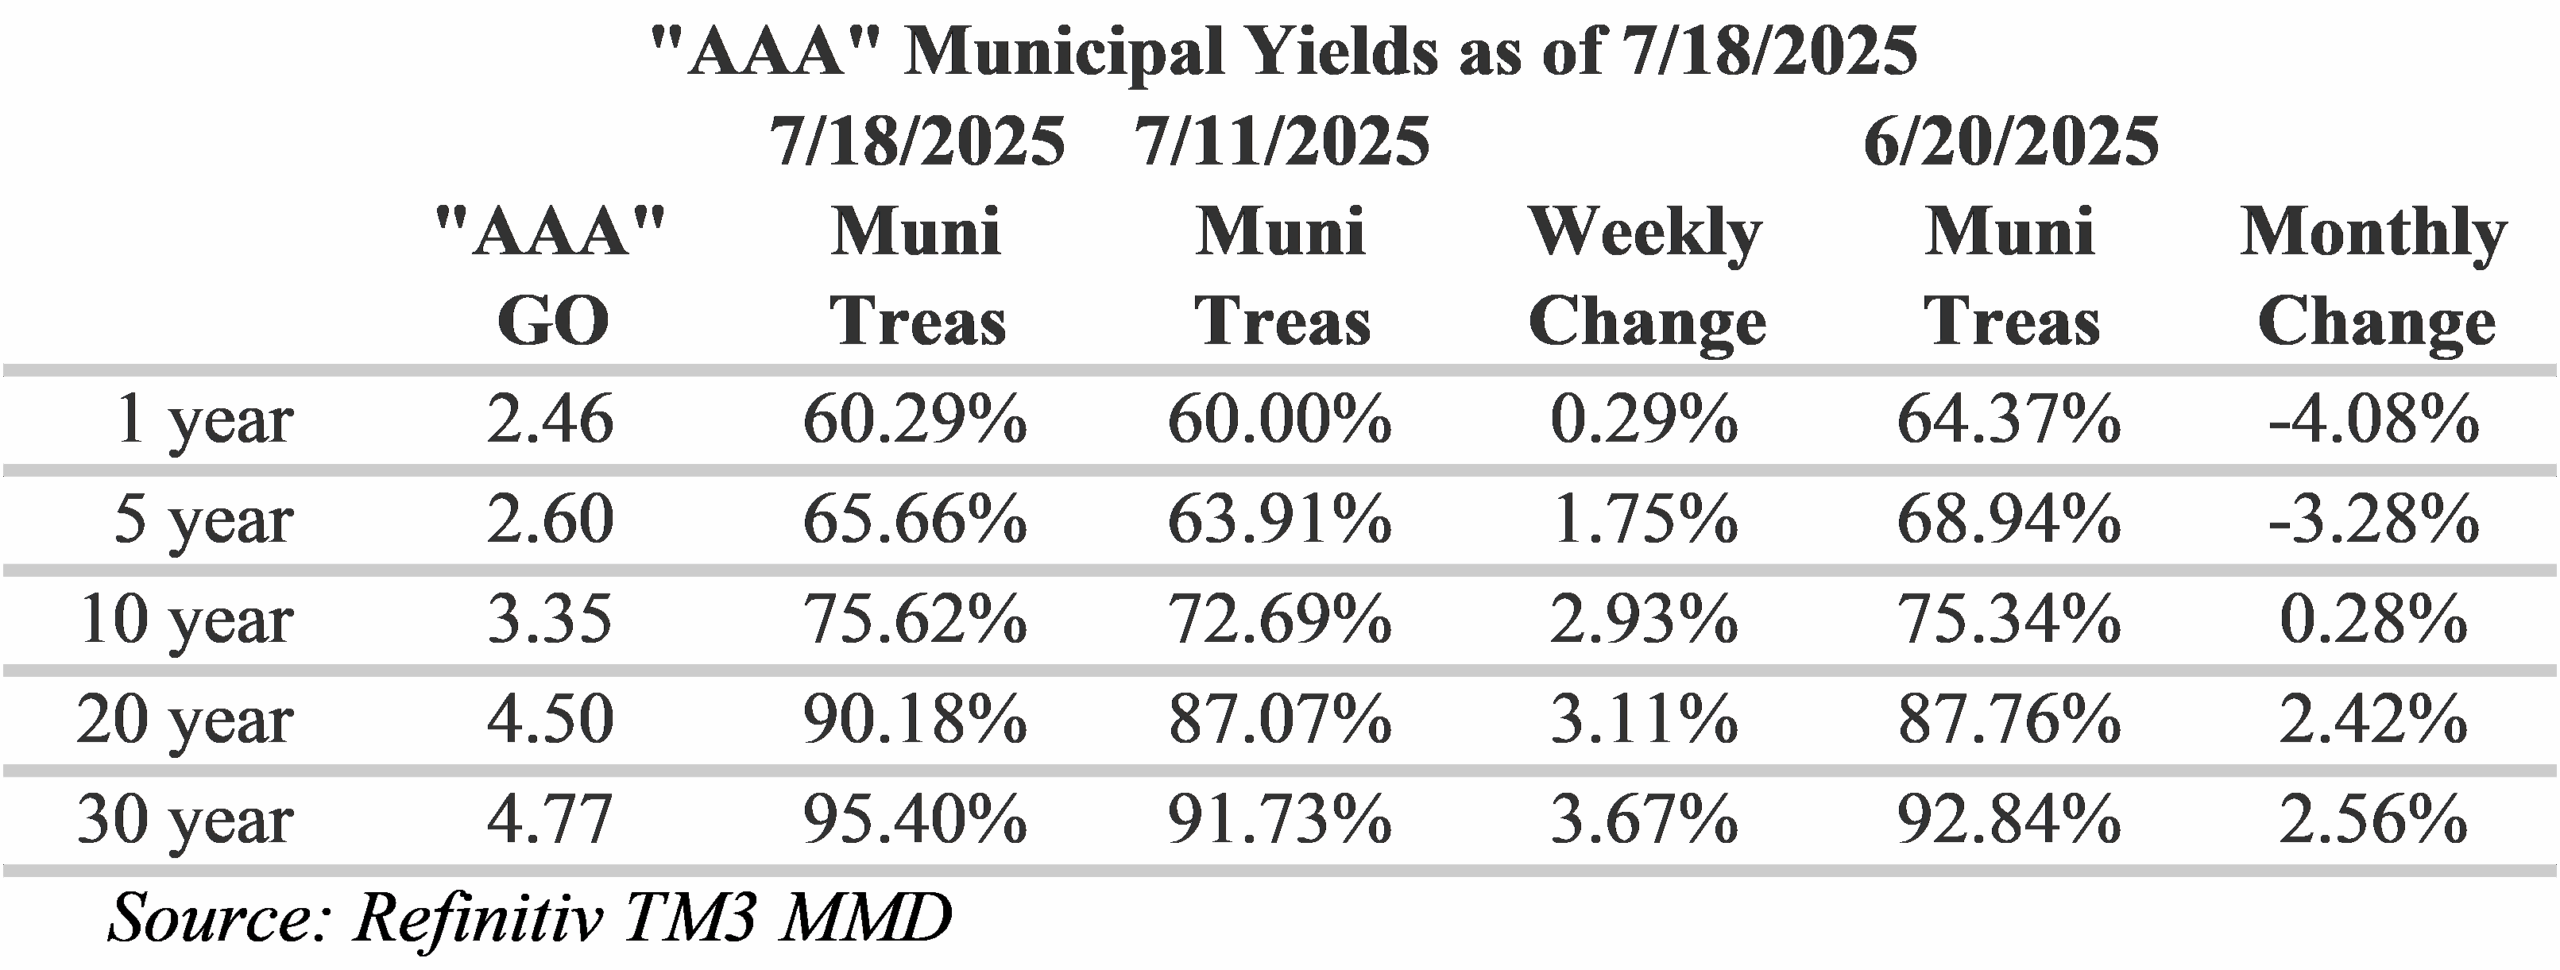
Muni/Treasury ratios have generally cheapened during this past week. Currently, 10-year munis are yielding over 75% of equivalent Treasuries and 30-year munis are yielding over 95% of equivalent Treasuries. Although ratios are rewarding extension out to the long-end of the yield curve, the slope of the curve flattens out significantly past 20-years which diminishes the reward to a traditional muni investors of duration extension.
Herbert J. Sims & Co. Inc. is a SEC registered broker-dealer, a member of FINRA, SIPC. The information contained herein has been prepared based upon publicly available sources believed to be reliable; however, HJ Sims does not warrant its completeness or accuracy and no independent verification has been made as to its accuracy or completeness. The information contained has been prepared and is distributed solely for informational purposes and is not a solicitation or an offer to buy or sell any security or instrument or to participate in any trading or investment strategy, and is subject to change without notice. All investments include risks. Nothing in this message or report constitutes or should be construed to be accounting, tax, investment or legal advice.
Our team of market analysts have a singular mission: to help you make better investment decisions. Read the latest market commentary.
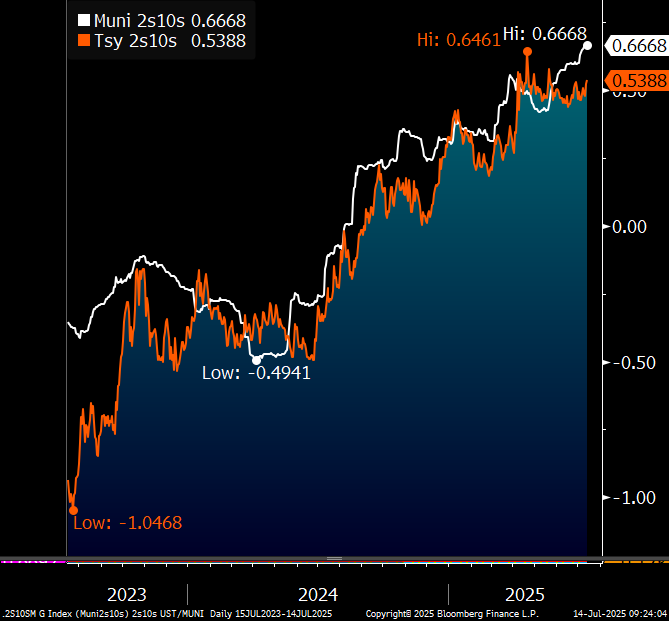
Continue readingOver the past week, a combination of tariff announcements, fiscal deficit anxiety and inflation concerns have driven long-term Treasury and municipal bond yields higher. Treasury yields past 10-years have generally risen by 3 to 4 basis points while shorter Treasury yields are generally 1 to 2 basis points lower, resulting in a steeper Treasury curve. The municipal yield curve exhibited a similar steepening with yields under 10-years generally 2 to 4 basis points lower and yields past 10-years generally 3 to 4 basis points higher. Looking at the 2s10s spread, which is the difference between the 10-year yield and the 2-year yield as an indicator of the steepness of the yield curve, the municipal curve has recently reached the steepest slope in over 2-years. This is an invitation for bond investors to extend duration.
Recently, slopes along the municipal curve have steepened significantly from 5 to 7-years, with an overall slope of 27 basis points, and remain steepest from 8 to 13-years, with an overall slope of 74 basis points. Although the 15 to 18-year portion of the curve remains appealing on a relative value basis, the overall slope is less appealing with a slope of only 45 basis points or 11.25 basis points per year. At the longer-end of the yield curve, extension is discouraged by the slope flattening to just a basis point or two per year. However, this flattening does create the opportunity for investors to pick-up 13-year maturities with yields that are 80% of the 30-year municipal yield and 18-year maturities with yields that are over 90% of the 30-year municipal yield.
Muni/Treasury ratios have generally become less attractive over the past week. However, the longer end of the municipal curve remains appealing. Currently, 10-year munis are yielding just under 75% of equivalent Treasuries and 30-year munis are yielding around 92% of equivalent Treasuries. Although ratios are rewarding extension out to the long-end of the yield curve, the slope of the curve flattens out significantly past 20-years to just a basis point or two per year. On a relative basis, positioning around the 13-year maturity yields an intriguing combination of 75% of equivalent Treasuries and 80% of the 30-year municipal curve.
Over the week ahead, municipal issuers are expected to sell more than $14 billion of bonds with year-to-date municipal bond issuance levels eclipsing $300 billion, which is the earliest ever. Some of the larger issues on the calendar are from the California Community Choice Financing Authority, which plans to sell $1 billion in bonds, the City & County of Honolulu, which plans to sell $733.4 million, and the City of Salt Lake Utah Airport, which plans to sell $450 million. This supply will likely be met with strong demand with $23.4 billion in municipal bonds expected to mature in the next 30-days and $5.6 billion in calls announced over the next 30-days.
Herbert J. Sims & Co. Inc. is a SEC registered broker-dealer, a member of FINRA, SIPC. The information contained herein has been prepared based upon publicly available sources believed to be reliable; however, HJ Sims does not warrant its completeness or accuracy and no independent verification has been made as to its accuracy or completeness. The information contained has been prepared and is distributed solely for informational purposes and is not a solicitation or an offer to buy or sell any security or instrument or to participate in any trading or investment strategy, and is subject to change without notice. All investments include risks. Nothing in this message or report constitutes or should be construed to be accounting, tax, investment or legal advice.
Our team of market analysts have a singular mission: to help you make better investment decisions. Read the latest market commentary.
Continue readingLast week, the President signed into law his “Big Beautiful Bill,” which reportedly contains roughly $4.5 trillion in tax cuts, and protects the tax exemption for municipal bonds and private activity bonds. The Bill also creates a new category of private activity bonds for “spaceports” and includes a few additional bond-related provisions. The preservation of the tax-exemption is of critical importance to the municipal bond market.
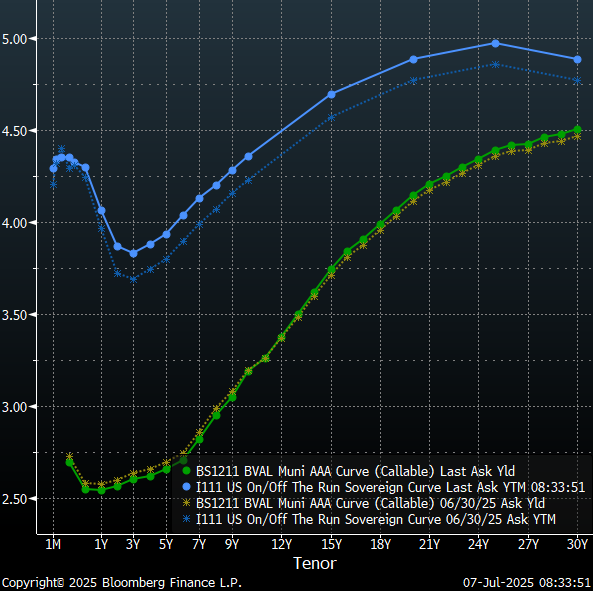
Muni and Treasury yields moved slightly higher over this past week with the long end of the Treasury curve remaining notable steep. The municipal yield curve steepened with yields dropping roughly 3 basis points per year on the short/short-intermediate potion of the yield curve and climbing by the same magnitude on the long-end with yields pivoting around the 10-year mark. Thursday’s jobs data, released by the Bureau of Labor Statistics, dashed the markets hopes of a July rate cut with nonfarm payroll employment increasing by 147,000 jobs in June, beating the census forecast of 110,000 jobs from economists polled by Dow Jones. Furthermore, the unemployment rate fell slightly from 4.2% to 4.1%. As a result, Treasury yields generally climbed throughout the curve over the past week, with an almost parallel shift upward of 13 to 16-basis points.
This week, municipal issuers are expected to sell more than $12.7 billion of bonds, following last week’s truncated holiday calendar. This supply will likely be met with strong demand following last week’s infusion of $958.89 million to municipal bond mutual funds, as reported by LSEG Lipper Global Fund Flows. In addition, $24.2 billion in municipal bonds are expected to mature in the next 30-days and $4.2 billion in calls have been announced over the next 30-days. Overall, technical conditions in the municipal bond market have been supportive of new issues and we expect this trend to continue.
Herbert J. Sims & Co. Inc. is a SEC registered broker-dealer, a member of FINRA, SIPC. The information contained herein has been prepared based upon publicly available sources believed to be reliable; however, HJ Sims does not warrant its completeness or accuracy and no independent verification has been made as to its accuracy or completeness. The information contained has been prepared and is distributed solely for informational purposes and is not a solicitation or an offer to buy or sell any security or instrument or to participate in any trading or investment strategy, and is subject to change without notice. All investments include risks. Nothing in this message or report constitutes or should be construed to be accounting, tax, investment or legal advice.
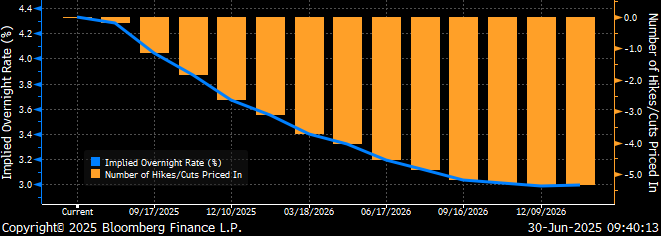
Treasury and municipal market yields rallied over this past week as the market fixated on the potential for the Fed to cut rates earlier than previously forecast. Sentiment was driven by dovish Fedspeak from Fed governors Bowman and Waller, first quarter GDP revisions to -0.5% and a benign May PCE report, all of which bolstered rate cut expectations. The futures market is now anticipating the Fed could cut rates as soon as September. However, Fed Chair Powell’s comments made last week to the House Financial Services Committee were clear, that the Fed is well positioned to wait citing elevated inflation and intensifying price pressures. Powell also commented that signs of weakness in the labor market would change the Fed’s stance. As a result, we may see some volatility in the capital markets following this week’s employment data releases on Tuesday and Thursday.
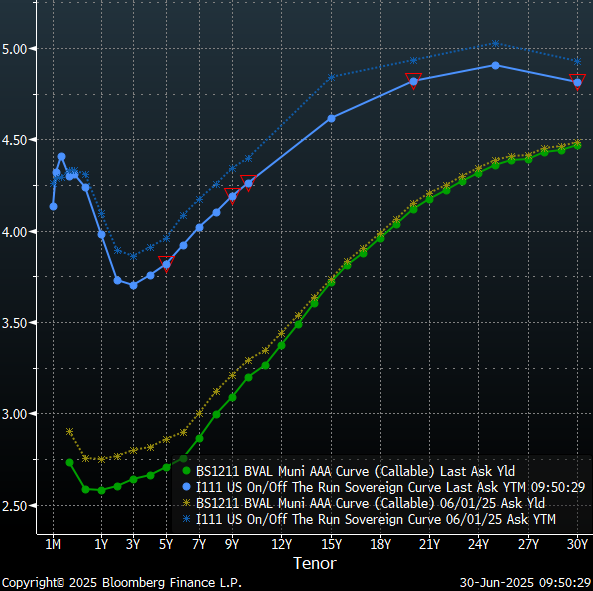
Over the past month, Treasury yields have rallied roughly 15-basis points from 2 to 10-years with a steeper dip of 23 basis points around the 15-year mark. While municipal yields held relatively steady, with declines of approximately 10 to 15-basis points from 2 to 10-years and 1 to 2 basis points for maturities past 15-years. As a result, muni/Treasury ratios have generally become more attractive with ratios enticing investors to extend portfolio durations with significantly higher ratios on longer maturities. Currently, 10-year munis are yielding over 76% of equivalent Treasuries and 30-year munis are yielding over 93% of equivalent Treasuries. The slope of the municipal yield curve is also rewarding extension with multiple spans along the yield curve in excess of 10 basis points per year. The steepest slopes have formed around the 10-year maturity, with an overall slope of 45 basis points from 9 to 11-years. Further out the municipal yield curve, slopes remain steep from 15 to 18-years, with an overall slope of 45 basis points. Slopes after this point taper off dramatically to just a basis point or two on the extreme long-end. The flattening on the longer-end of the yield curve allows investors to buy 17-year maturities with yields that are 90% of the 30-year municipal maturity.

Although municipal bond mutual fund flows have been steadily weakening, supply/demand technical conditions remain strong with nine consecutive weeks of positive fund flows and investors anticipating $45 billion of interest payments, maturing and called principal this week. LSEG Lipper Global Fund Flows reported municipal bond mutual funds saw an additional $76.9 million from investors. The majority of the inflows were directed to high-yield funds, which registered an additional $45.4 million compared to the previous week’s $57.7 million. This week, the calendar has contracted to $5.78 billion, which is relatively heavy for a holiday week with an early close. This past June is anticipated to be the largest June on-record for issuance and year-to-date, municipal issuance has already reached $277.8 billion, which is 17.8% ahead of last -year at this time.
Herbert J. Sims & Co. Inc. is a SEC registered broker-dealer, a member of FINRA, SIPC. The information contained herein has been prepared based upon publicly available sources believed to be reliable; however, HJ Sims does not warrant its completeness or accuracy and no independent verification has been made as to its accuracy or completeness. The information contained has been prepared and is distributed solely for informational purposes and is not a solicitation or an offer to buy or sell any security or instrument or to participate in any trading or investment strategy, and is subject to change without notice. All investments include risks. Nothing in this message or report constitutes or should be construed to be accounting, tax, investment or legal advice.
Our team of market analysts have a singular mission: to help you make better investment decisions. Read the latest market commentary.
Continue readingAlthough last week was a holiday week, there was a steady stream of potentially impactful headlines ranging from escalating tensions in the Middle East to an FOMC meeting. Although Fed officials left interest rates unchanged at last week’s meeting, the conflict in the middle east has disrupted air traffic, rattled global markets, and raised concerns of oil prices and inflation. However, Treasury bond yields generally slid last week amid elevated recession concerns following a disappointing release of data by the Census Bureau indicating retail sales dropped by 0.9% in May, significantly below the 0.6% contraction previously estimated by economists surveyed by Dow Jones.
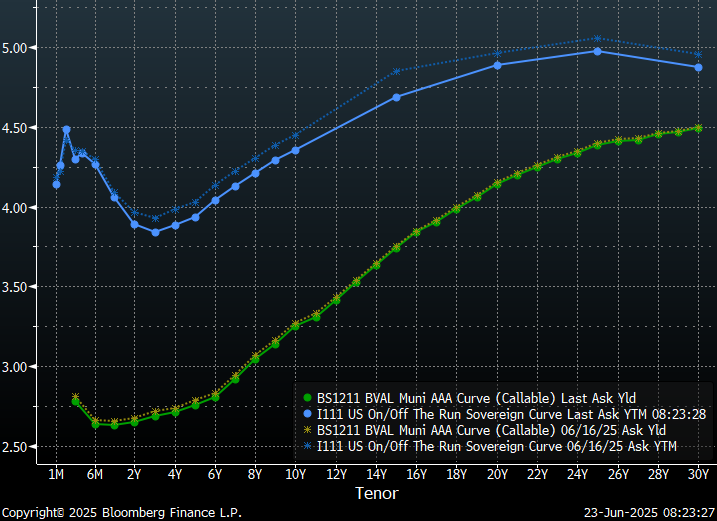
Over the past week, Treasury yields slid roughly 10-basis points from 5 to 30-years with a steeper dip of 20 basis points around the 15-year mark. While municipal yields held relatively steady with declines of approximately 3 basis points for maturities within 10-years and only a basis point a year on longer tenors. As a result, muni/Treasury ratios have generally become more attractive with ratios enticing investors to extend portfolio durations with significantly higher ratios on longer maturities. Currently, 10-year munis are yielding over 75% of equivalent Treasuries and 30-year munis are yielding almost 93% of equivalent Treasuries. The slope of the municipal yield curve is also rewarding extension with multiple spans along the yield curve in excess of 10 basis points per year. The steepest slopes have formed around the 10-year maturity, with an overall slope of 43 basis points from 9 to 11-years. Further out the municipal yield curve, slopes remain steep from 15 to 18-years, with an overall slope of 45 basis points. Slopes after this point taper off dramatically to just a basis point or two on the extreme long-end. The flattening on the longer-end of the yield curve allows investors to buy 17-year maturities with yields that are 90% of 30-year maturities.

Secondary trading volumes slowed last week as attentions were divided by the short week. However, municipal market technicals remain accommodative, with last week’s approximately $6 billion municipal calendar was taken down with relative ease amid $32 billion in bonds maturing over the next 30-days and an additional $7.5 billion in announced bond calls. LSEG Lipper Global Fund Flows reported municipal bond mutual funds experienced their eighth consecutive week of inflows, albeit with a modest $110.5 million being added to the asset class. High-yield funds saw an additional $57.7 million compared to the previous week’s $138 million. This week, the calendar has expanded to $11.8 billion in new issues to close-out June as one of the highest supply months seen in recent years. Year-to-date, municipal issuance has reached $265 billion, which is 19.4% ahead of last -year at this time.

Herbert J. Sims & Co. Inc. is a SEC registered broker-dealer, a member of FINRA, SIPC. The information contained herein has been prepared based upon publicly available sources believed to be reliable; however, HJ Sims does not warrant its completeness or accuracy and no independent verification has been made as to its accuracy or completeness. The information contained has been prepared and is distributed solely for informational purposes and is not a solicitation or an offer to buy or sell any security or instrument or to participate in any trading or investment strategy, and is subject to change without notice. All investments include risks. Nothing in this message or report constitutes or should be construed to be accounting, tax, investment or legal advice.
Our team of market analysts have a singular mission: to help you make better investment decisions. Read the latest market commentary.
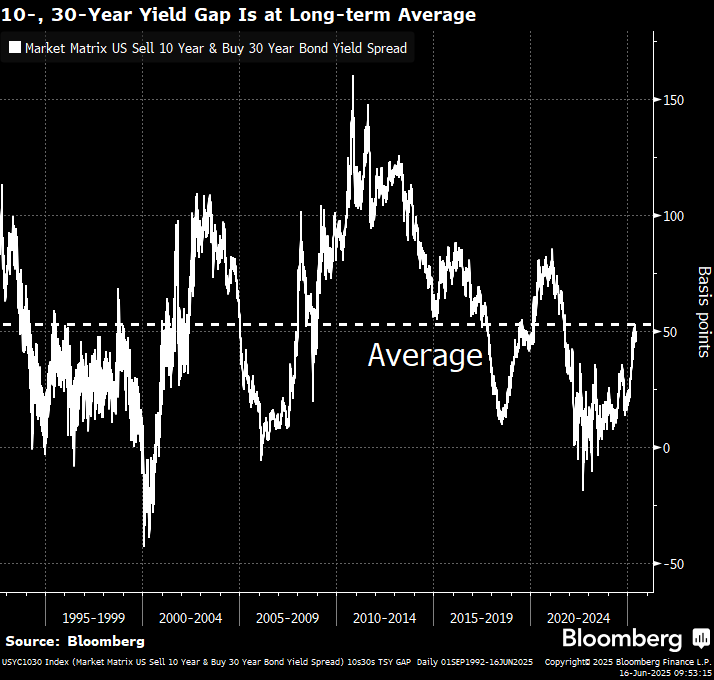
Continue readingFrom the perspective of the trade desk, last week was another challenging week with attentions focused on new deals rather than the secondary market. Both municipal and Treasury markets responded to last week’s reports of slower growth and lower inflation with yields dropping approximately three to six basis points across both curves. However, this week escalating overseas tensions in Israel and Iran are placing upward pressure on yields. Not surprisingly, both Brent and West Texas Intermediate crude oil prices have risen above $70 per barrel sparking concerns of inflation among traders and placing additional upward pressure on long-term yields. These concerns are in addition to the existing inflationary concerns related to the trade wars, spiraling U.S. debt concerns and traders demanding a higher premium for the risk of lending to governments following Moody’s downgrade of the United States credit rating to ‘Aa1.’ Overall, the yield gap between 10 and 30-year Treasuries has reached the widest levels we have seen since 2021.
Over the past week, attentions on the trade desk have been more focused on the short-end of the curve as accounts look for safety amid global conflict, economic and policy uncertainties. The municipal curve has responded with steeper slopes in the longer-intermediate tenors with extension risk being rewarded from 2034 all the way out to 2043 with a collective 116 basis points of slope over the 10-year period. The 2036 maturity now offers over 75% of the 30-year municipal maturity and over 75% of equivalent Treasury yields. Going out an additional 6 years to 2042 nets an additional 64 basis points of yield, or 90% of the 30-year municipal maturity, and 83% of equivalent Treasury yields. Slopes on the long-end of the municipal curve taper significantly past 20-years with only a basis point or two of slope on the long-end.
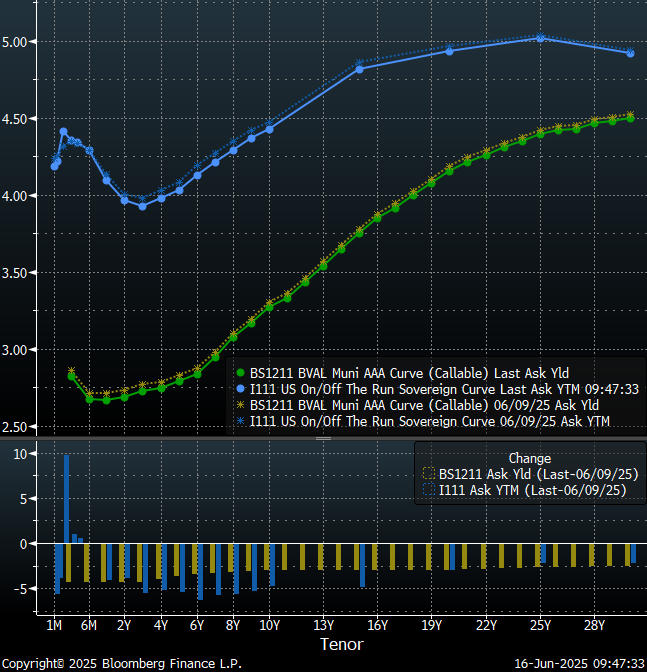
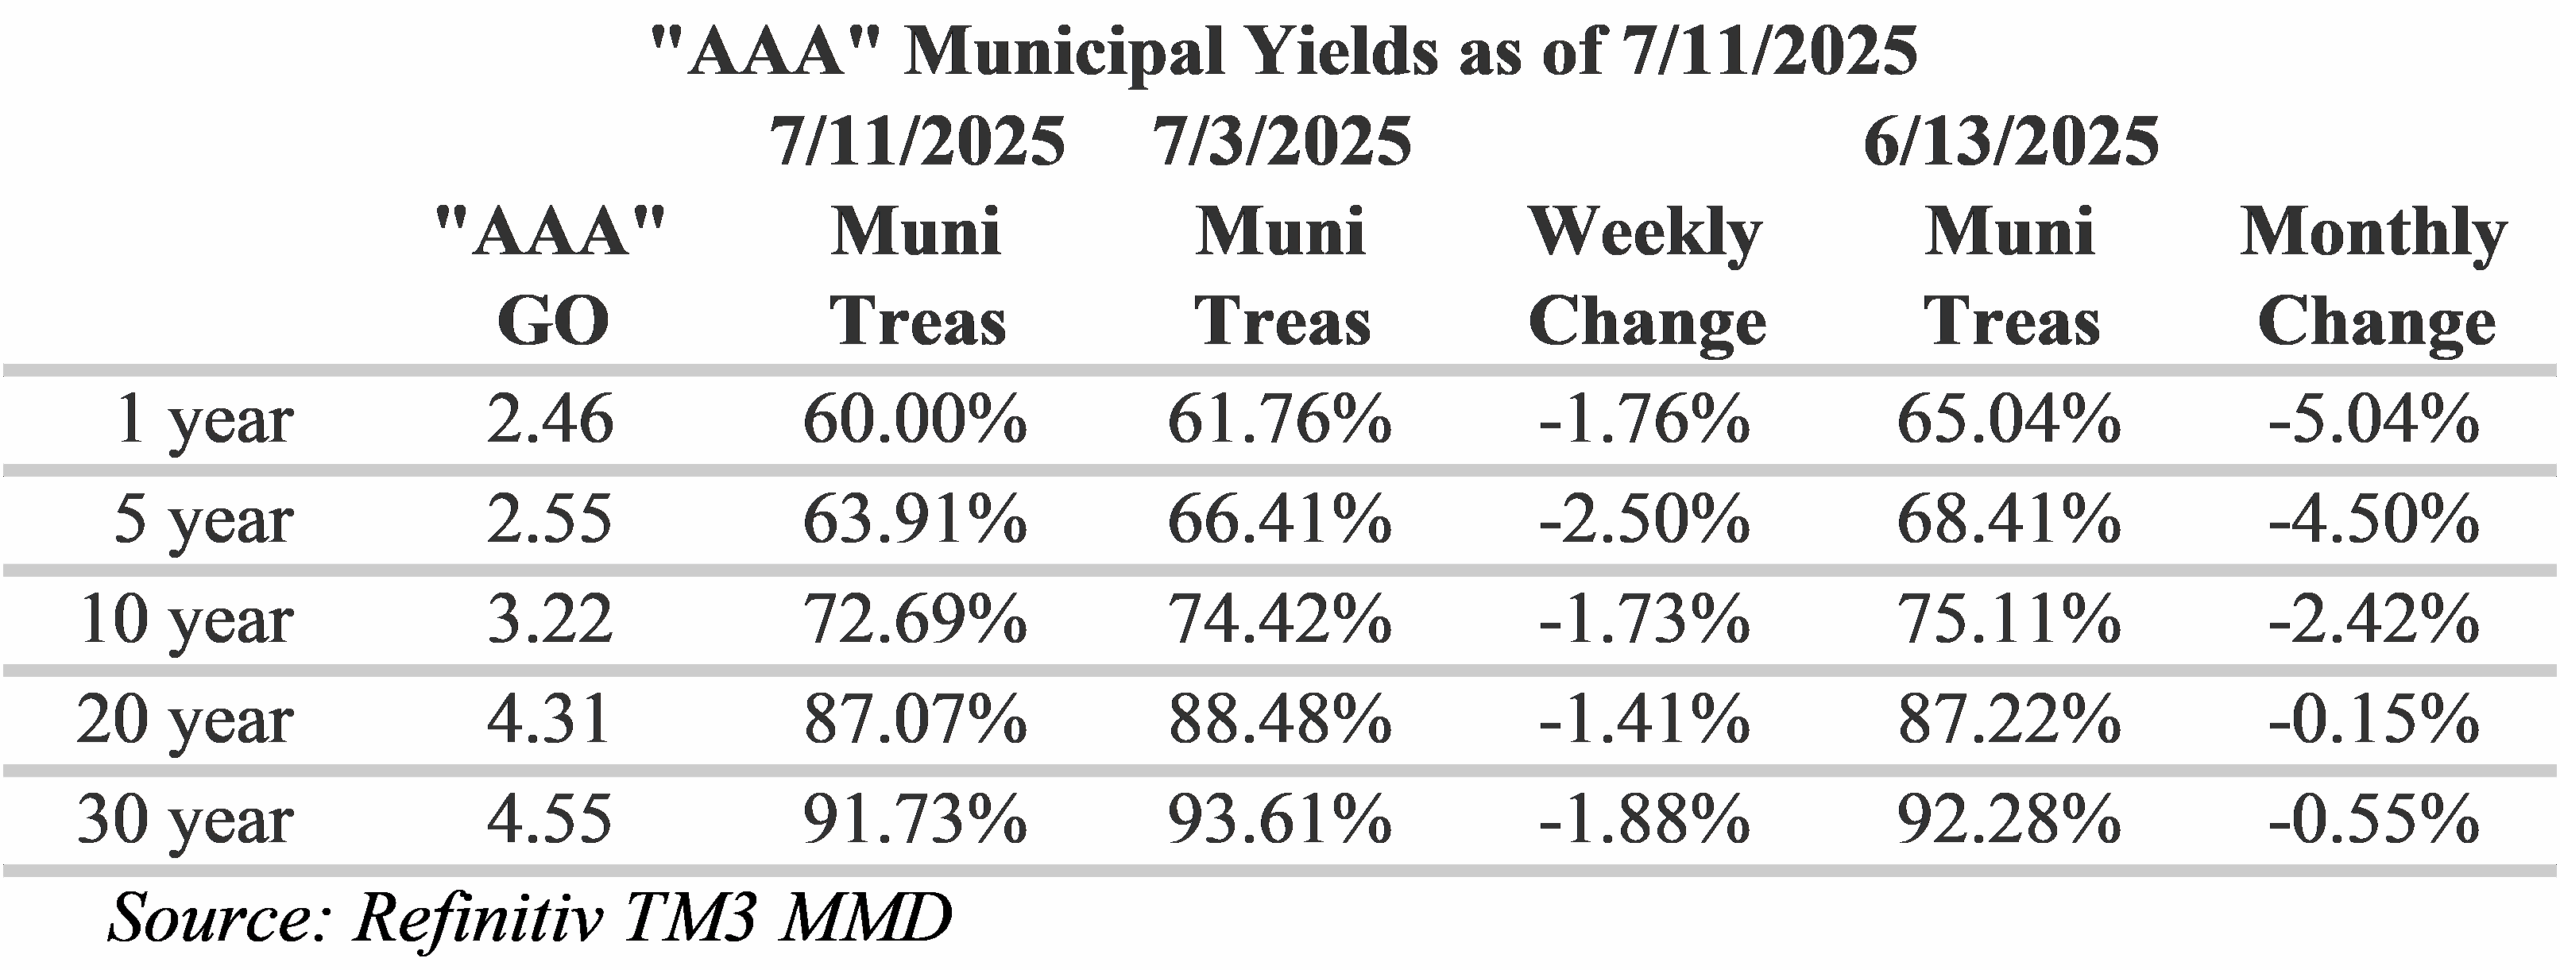
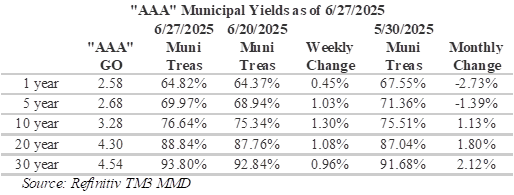
Muni/Treasury ratios have been relatively balanced over the past week declining on the short-end and increasing on the long-end with the largest changes in the intermediate portion of the curve around 10-years. Long-term ratios remain appealing, with 20-year munis yielding 87.22% of Treasuries and 30-year munis yielding 92.28% of Treasuries. Over the past week, we have seen ratios drop down to 65% in the 1-year tenor as investors migrate toward the safety afforded by the shorter end of the yield curve.

Ahead of the upcoming FOMC meeting and the Juneteenth holiday, the municipal market is anticipating a slower week as issuers are scheduled to bring $5.73 billion in new deals to market versus $17 billion last week. Market technicals remain receptive to strong issuance with LSEG Lipper Global Fund Flows reporting municipal bond mutual funds saw a seventh consecutive week of inflows with $523 million being added to the asset class following $426 million of inflows the prior week. Long-term muni funds added $72 million while high-yield funds saw an additional $138 million and intermediate funds added $35 million. In addition, $35.4 billion in municipal bonds are maturing over the next 30-days and an additional $7.8 billion of bond calls has been announced.
Herbert J. Sims & Co. Inc. is a SEC registered broker-dealer, a member of FINRA, SIPC. The information contained herein has been prepared based upon publicly available sources believed to be reliable; however, HJ Sims does not warrant its completeness or accuracy and no independent verification has been made as to its accuracy or completeness. The information contained has been prepared and is distributed solely for informational purposes and is not a solicitation or an offer to buy or sell any security or instrument or to participate in any trading or investment strategy, and is subject to change without notice. All investments include risks. Nothing in this message or report constitutes or should be construed to be accounting, tax, investment or legal advice.