Our team of market analysts have a singular mission: to help you make better investment decisions. Read the latest market commentary.
Continue readingCurve Commentary: June 9, 2025
Overview
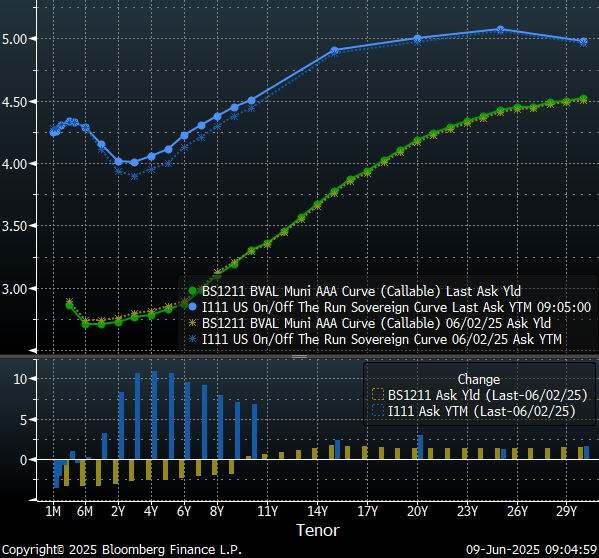
Last week, the municipal market was flooded by issuance as state and local governments unloaded $20 billion in new deals, marking the largest issuance volume in almost eight years. The municipal market is anticipating another big week with issuers currently scheduled to bring $17 billion in new deals to market ahead of the upcoming FOMC meeting and the Juneteenth holiday. However, despite the challenging volume of deals being processed by the market, municipal yields have held steady, even outperforming Treasuries, with a rally of two to three basis points in tenors under ten years and a minor sell-off of one to one and a half basis points out long. As a result, the MMD municipal yield curve has modestly steepened by about 11 basis points over the past week. In contrast, Treasuries have flattened from two to 30-years with tenors under ten years selling-off as much as ten basis points as the Treasury market responded to a stronger than expected jobs report and continued policy uncertainties.

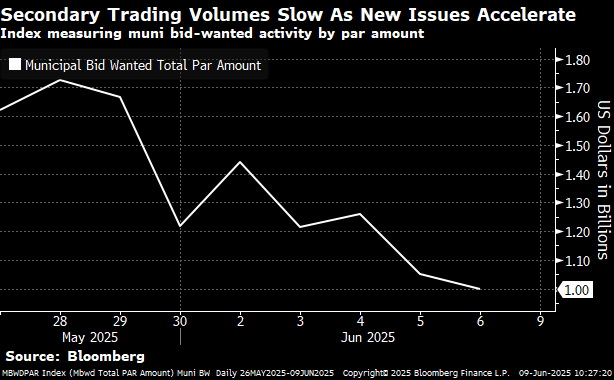
From the perspective of the trade desk, this has been another challenging week with attentions focused on new deals rather than the secondary market. Not surprisingly, secondary trading volumes have progressively slowed as new issue volume has accelerated. Inquiries have been more focused on the short-end of the curve with investors seeking asylum amid economic and policy uncertainties. The municipal curve has responded with steeper slopes in the longer-intermediate tenors with 41 basis points of slope from 2034 to 2036, with the 2036 maturity now offering approximately 75% of Treasury yields. In addition, slopes remain steep from 2040 to 2043, rewarding investors that travel further out the curve with approximately 85% of Treasury yields in 2043. Slopes on the long-end of the municipal curve taper significantly past 20-years, with a basis point or two of slope on the long-end. Currently, 20-year munis offer 95% of 30-year yield.

Ratios and Strategy
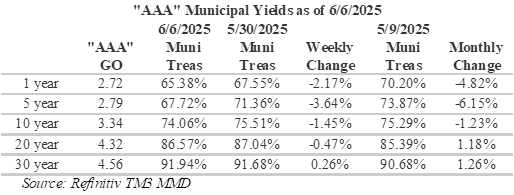
Muni/Treasury ratios have responded with mixed results over the past week, declining by over two percent on the short-end and remaining practically unchanged on the long -end. However, long-term ratios remain appealing, with 20-year munis yielding 86.57% of Treasuries and 30-year munis yielding 91.94% of Treasuries. Over the past week, we have seen ratios dip below 70% to 67.72% in the 5-year tenor, primarily due to the notable sell-off in Treasuries in that part of the curve over the past week.

Year-to-date, long-term municipal issuance is $240.5 billion, which is up 17.8% versus the same time period last year. Fortunately, market technicals remain receptive to strong issuance with $34.7 billion in bonds maturing over the next 30-days and an additional $12.5 billion in announced bond calls. In addition, LSEG Lipper Global Fund Flows reported municipal bond mutual funds saw a sixth consecutive week of inflows with $426 million being added to the asset class following $526 million of inflows the prior week. Long-term muni funds gained $45 million while high-yield funds added $281 million and intermediate funds added $110 million.
Herbert J. Sims & Co. Inc. is a SEC registered broker-dealer, a member of FINRA, SIPC. The information contained herein has been prepared based upon publicly available sources believed to be reliable; however, HJ Sims does not warrant its completeness or accuracy and no independent verification has been made as to its accuracy or completeness. The information contained has been prepared and is distributed solely for informational purposes and is not a solicitation or an offer to buy or sell any security or instrument or to participate in any trading or investment strategy, and is subject to change without notice. All investments include risks. Nothing in this message or report constitutes or should be construed to be accounting, tax, investment or legal advice.
Market Commentary: Bright College Years
Our team of market analysts have a singular mission: to help you make better investment decisions. Read the latest market commentary.
Continue readingGrace Inspired Living Case Study (May 2025)
HJ Sims Successfully Completes
Tax-Exempt Financing
Enabling Affiliation
Integration and Funding
Continuing Campus Growth
FOREST HILLS OF DC (May 2025)
Forest Hills of DC
Enhances Long-Term
Position by Affiliating
with Goodwin Living
Case Study (May 2025)
HJ Sims Provides $4.3 Million
Mezzanine Loan for Skilled Nursing
Acquisition
Curve Commentary: June 2, 2025
Overview
Long-term US Treasury yields have recently popped-up to their highest level in over a year, driven by the passage of the budget by the US House of Representatives and widespread concerns of escalating deficits. The biggest deficit driver is the proposed extension of the Tax Cuts and Jobs Act of 2017, which is estimated to add $3.5 to $4.0 trillion to the current deficit, likely requiring the issuance of additional Treasury securities. However, demand for Treasuries is waning as countries like China and Japan have been decreasing their holdings due to trade tensions and a stronger US dollar. Yields on 2, 5 and 10-year notes, by comparison, have fallen resulting in a widening gap between the 10-year and the 30-year bond. Although this gap is widening, it is still within long-term historical averages.

Looking at shorter tenors, the slope of the municipal 2s10s curve has reached 53 bps, the steepest level observed since 2022. This marks a complete reversal from the minus 50 bps seen last year at about this time, in April 2024, as yield relationships along the curve continue to normalize. Similarly, the US Treasury 2s10s curve has a slope of 52 bps, which is far more approachable than the minus 108 bps seen in mid-2023. With steeper slopes shorter on the curve, investors can capture a substantial percentage of 30-year rates over significantly shorter duration exposures. Currently, 10-year munis are yielding approximately 75% of the 30-year maturity and 18-year munis are yielding approximately 93% of the 30-year maturity.

Ratios and Strategy
Recent yield shifts have resulted in muni/Treasury ratios declining by almost a percent on the short-end and increasing by 1.4% on the long -end. Although long-term ratios remain appealing, the yield differentials between municipals and Treasuries have tightened over the past month with 5-year ratios declining from over 75% down to 71% as investors move to the shorter end of the curve amid rate volatility. At the long-end, municipal continue to yield over 90% of equivalent Treasury bonds, which continues to be appealing to investors. However, as mentioned earlier, compelling values are available at shorter durations with 20-year munis yielding 87% of Treasuries. Nevertheless, as discussed below, ratios are likely to be range bound as municipals head into the more technically driven portion of the year.

Technical Factors
Year-to-date long-term municipal issuance is $220.5 billion, which is up 17.3% versus the same time period last year. Issuance is expected to pick-up this week with US state and local governments slated to sell more than $19.1 billion of bonds, which is the highest weekly total this year and one of the largest weekly calendars on record and is expected to accelerate over the next month. On this week’s calendar, there are multiple billion dollar issues scheduled lead by Indiana University Health is with its $1.5 billion issue and the Commonwealth of Pennsylvania with a $1.17 billion issue.

Last week, LSEG Lipper Global Fund Flows reported municipal bond mutual funds saw a fifth consecutive week of inflows with $526 million being added to the asset class following $768 million of inflows the prior week. Long-term municipal funds gained $203 million while high-yield funds added $150 million and intermediate funds added $79 million. However, despite the inflows, trading volumes fell to the lowest level seen in 2025 last week amid healthy but cooling demand.
Herbert J. Sims & Co. Inc. is a SEC registered broker-dealer, a member of FINRA, SIPC. The information contained herein has been prepared based upon publicly available sources believed to be reliable; however, HJ Sims does not warrant its completeness or accuracy and no independent verification has been made as to its accuracy or completeness. The information contained has been prepared and is distributed solely for informational purposes and is not a solicitation or an offer to buy or sell any security or instrument or to participate in any trading or investment strategy, and is subject to change without notice. All investments include risks. Nothing in this message or report constitutes or should be construed to be accounting, tax, investment or legal advice.


