
Overview
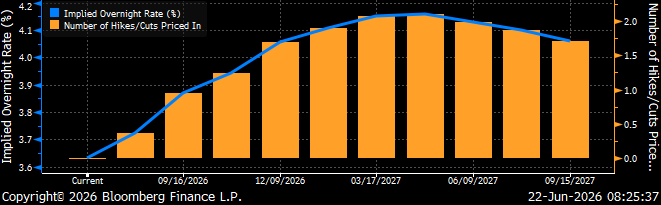
Last week the Federal Open Market Committee (FOMC) voted to hold the benchmark federal funds rate in a range of 3.5% to 3.75%, at the first gathering with Kevin Warsh as “Chairman.” At the meeting, officials signaled growing support for rate hikes this year with half of the individual Fed members expecting to raise rates by the end of the year. Furthermore, Warsh repeatedly reiterated the Fed’s commitment to fighting inflation. Fed rate-hike expectations have recently shortened significantly with Fed Funds Futures pricing in two 25bp moves by March 2027. Fed funds futures are now anticipating the Fed will hike rates 25bp as soon as October.
Implied Overnight Rate & Number of Hikes/Cuts
Insights and Strategy
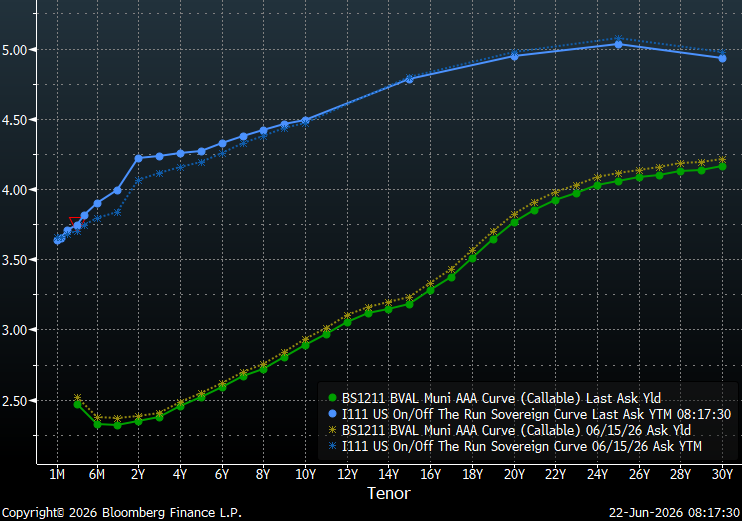
The gap between two- and 10-year Treasury yields and between five- and 30-year yields has narrowed to the tightest levels in more than a year. This flattening is the result of shorter-dated Treasuries anticipating rate hikes while longer maturities price-in a tougher inflation stance. However, the municipal yield curve has responded in a more even fashion with an almost parallel shift downward with the first six-months remaining inverted. Although the yield curve has flattened, Investors continue to be rewarded for extending out the yield curve, with the steepest yields in the 18-21-year maturity range. The slope at the long-end of the municipal yield curve, past 20-years, remains relatively flat with a total slope of 31 bps from 21-30-years. Due to this flat tail, municipal bond investors can currently buy 20-year maturities that yield almost 90% of the 30-year curve versus less than 70% for 10-year maturities.
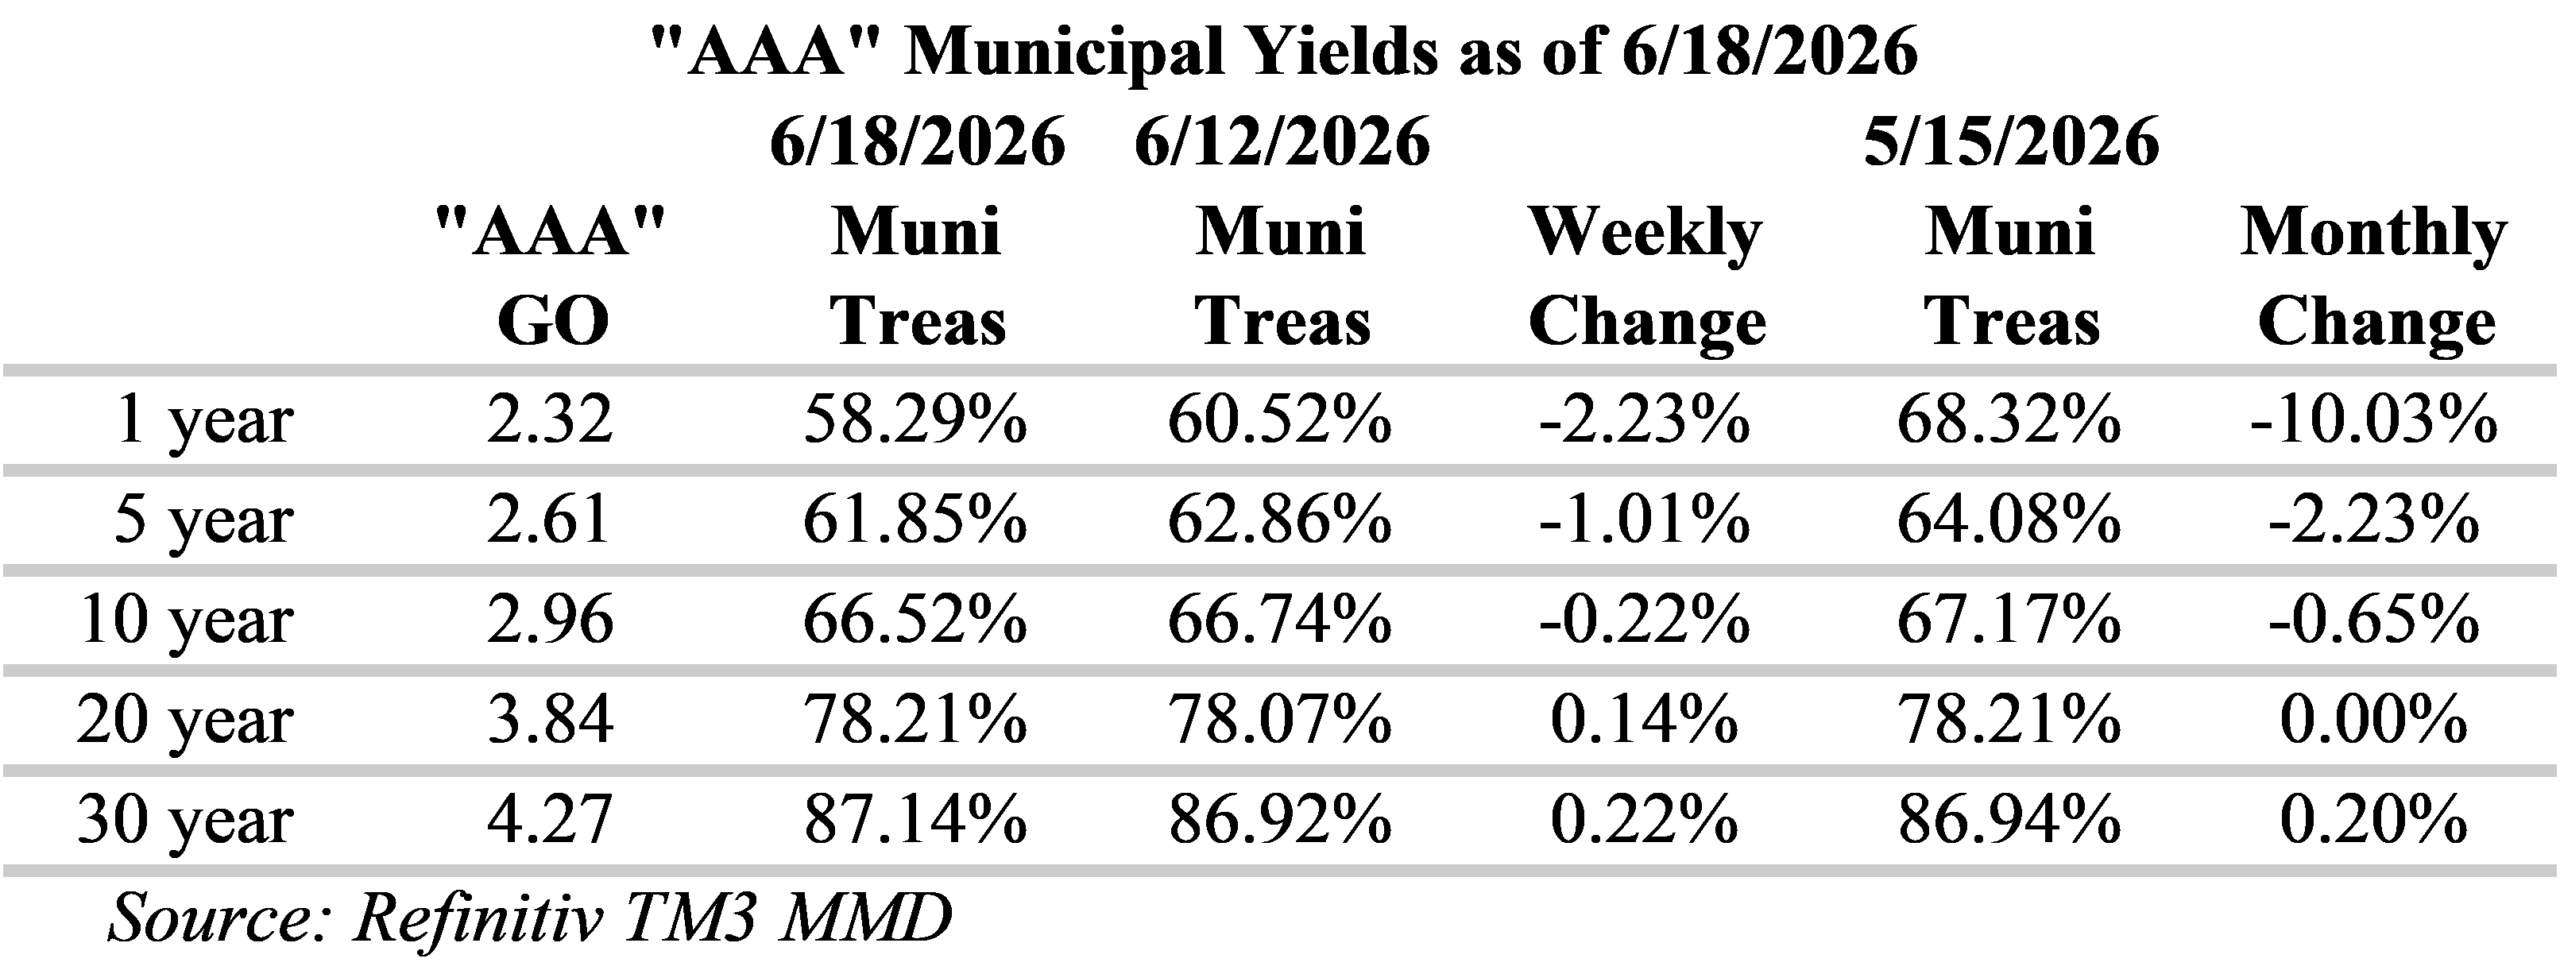
Over the past week, municipal/Treasury ratios have generally declined for periods shorter than 10-years, with one-year ratios now well below 60%. Ratios on the long-end, for 20-yewars and longer, are now slightly higher. Municipals have now fallen well below several important reference points along the curve. Ratios for 10-year municipal yields are now well under 70% of Treasuries, 20-year ratios are below 80% and 30-year ratios are below 90% of Treasuries. For investors seeking to maximize curve positioning with relative value, the 19 to 21-year part of the municipal yield curve is attractive with slopes of 12 to 13-bps per year and yields around 80% of Treasuries. Although ratios past 20-years are more attractive, relative to Treasuries, the yield curve is very flat over these longer tenors.
The Municipal the new issue calendar remains relatively robust this week with US state and local governments expected to sell over $12 billion of bonds. Notable deals include: the State of Georgia with $1.57 billion, Massachusetts Bay Transportation Authority Sales Tax Revenue is scheduled to sell $767.4 million, Santa Clara Unified School District is selling $438 million and Central Florida Expressway Authority is expected to bring $430.6 million to the market. In addition, technical conditions remain supportive of the primary market. Last week, municipal bond investors added approximately $1.19 billion to municipal-bond funds, according to LSEG Lipper Global Fund Flows. Furthermore, June tax-exempt reinvestment proceeds are expected to reach approximately$54.5 billion.
Herbert J. Sims & Co. Inc. is a SEC registered broker-dealer, a member of FINRA, SIPC. The information contained herein has been prepared based upon publicly available sources believed to be reliable; however, HJ Sims does not warrant its completeness or accuracy and no independent verification has been made as to its accuracy or completeness. The information contained has been prepared and is distributed solely for informational purposes and is not a solicitation or an offer to buy or sell any security or instrument or to participate in any trading or investment strategy, and is subject to change without notice. All investments include risks. Nothing in this message or report constitutes or should be construed to be accounting, tax, investment or legal advice.