
Overview
The war in the Middle East continues to draw the markets focus as bond traders attempt to manage inventory exposure with oil prices now through $100 per barrel. Last week’s softening labor market data from the Bureau of Labor Statistics and skyrocketing oil prices have fixed income markets nervous that energy costs could trigger a surge in inflation while constricting economic growth. Not surprisingly, Fed Funds Futures are now implying only one rate cut over the next 12-months and another cut 12-months later.
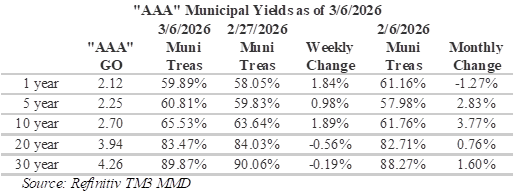
Although the long-end of both the municipal and Treasury yield curves has experienced increases of similar magnitude over the past week, tenors less than 1-year have performed remarkably different. While six-month Treasury yields are virtually unchanged from last week, munis in this range increased by 10bps. The impact of this difference is a treasury curve that is steepening and a muni curve that is shifting upward in a more parallel fashion. The result contradicts recent trends, with muni/Treasury ratios for periods 10-years and less have becoming more attractive over the past week while longer tenors become slightly less favorable. Currently, ratios for maturities shorter than 1-year are yielding almost 60% of their Treasury equivalents while 30-year munis are yielding just under 90% of equivalent Treasuries.
Insights and Strategy
Despite shifting muni/Treasury ratios, slopes along the municipal yield curve continue to reward extending duration. Investors are currently incented to move out the yield curve with appealingly steep yields in the 10-20 year range, with a slope of 124 bps, versus only 58 bps from 1-10 years. Currently, the steepest slopes on the municipal curve are available from 15 to 20-years where investors can pick-up approximately 69 bps. However, caution is advised for tenors past 20-years, where there is only 32 bps to be gained by extending all the way out to 30-years. It is also notable that although municipal curve slopes remain appealingly steep, they have also moderated in certain portions of the curve over the past week.
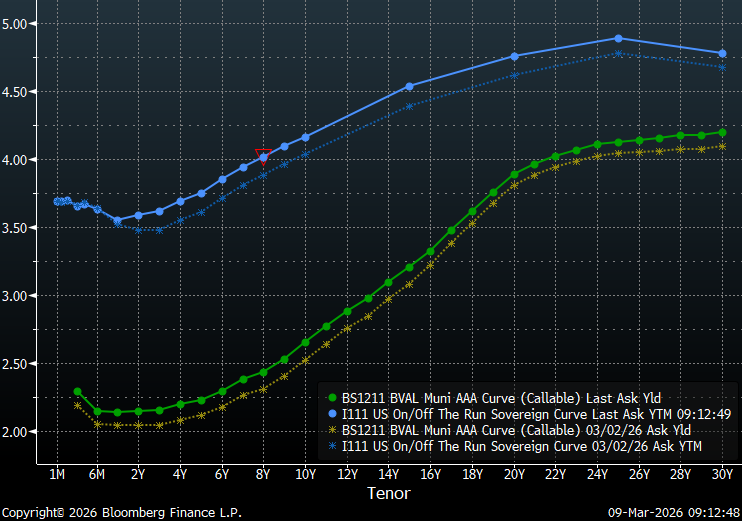
Nevertheless, by positioning in the longer intermediate portion of the curve, investors benefit from a steep roll-down over time. Furthermore, due to flat long-term rates, municipal bond investors can currently buy maturities under 20-years that yield almost 90% of the 30-year curve. With muni/Treasury ratios for 10-year and shorter maturities, although improved, still quite rich at under 60%. extending maturities further out the curve have the added benefit of more appealing relative yields. Ratios in 20-year and longer maturities remain attractive, relative to Treasuries, due to seasonal activity and wider spreads. However, the yield curve remains very flat over these longer tenors. For investors seeking to maximize curve positioning with relative value, the 17 to 20-year part of the municipal yield curve has become very tempting with slopes of 15 to 16-bps per year.
This week’s deal municipal bond deal calendar anticipates another week of strong issuance with an estimated $13.5 billion of new issues. Notable issues include: the Dormitory Authority of the State of New York, which plans to sell $2.575 billion; the State of California is scheduled to sell $2.387 billion in general obligation bonds, and California Community Choice is expected to sell $904.945 million in clean energy project revenue bonds. Due to current events, it is possible the status of current deals may change as conditions evolve. Despite 15 consecutive weeks of inflows and approximately $1.4 billion being added to municipal bond funds last week, according to LSEG Lipper Global Fund Flows, investors may be reluctant to commit capital due to international events. Considering current muni/Treasury ratios, it is not surprising that the majority of inflows are going to intermediate and long-term muni funds.
Herbert J. Sims & Co. Inc. is a SEC registered broker-dealer, a member of FINRA, SIPC. The information contained herein has been prepared based upon publicly available sources believed to be reliable; however, HJ Sims does not warrant its completeness or accuracy and no independent verification has been made as to its accuracy or completeness. The information contained has been prepared and is distributed solely for informational purposes and is not a solicitation or an offer to buy or sell any security or instrument or to participate in any trading or investment strategy, and is subject to change without notice. All investments include risks. Nothing in this message or report constitutes or should be construed to be accounting, tax, investment or legal advice.