
Overview
Economic data releases resumed last Thursday with the U.S. Department of Labor’s (BLS) release of the long-delayed September employment report. The BLS report did not deliver the clarity that markets are seeking regarding the central bank’s likely path. Although nonfarm payroll employment came in stronger than expected with 119,000 jobs added in September, the report also showed the jobless rate edging-up to the highest level in nearly four years to 4.4%. The increase in the jobless rate is not all that surprising, given the widely reported agency-by-agency filings showing the administration attempted to terminate a total of 3,605 employees during the shutdown. Employment gains were driven by health care, food services and drinking places, and social assistance. To add to the market’s uncertainty, the BLS will not be publishing the October employment report until after the Fed issues its decision on December 10 which is also when it will be releasing November data.
Rate expectations have varied widely in recent weeks due to conflicting information from Fed policymakers and a lack of clear signals on jobs and inflation. Last Wednesday, the Fed funds futures market was pricing-in the probability of a third rate cut this year in the high 20% range. Following comments from New York Fed President John Williams on Friday indicating the possibility of lower interest rates in the near-term as the labor market softens, investors boosted the odds of a rate cut to around 70%. As the Thanksgiving holiday approaches and traders look to the Federal Reserve for indications of policy easing, traders are fully pricing in a quarter-point cut at the January meeting and an additional cut by the June 2026 meeting.
Insights and Strategy
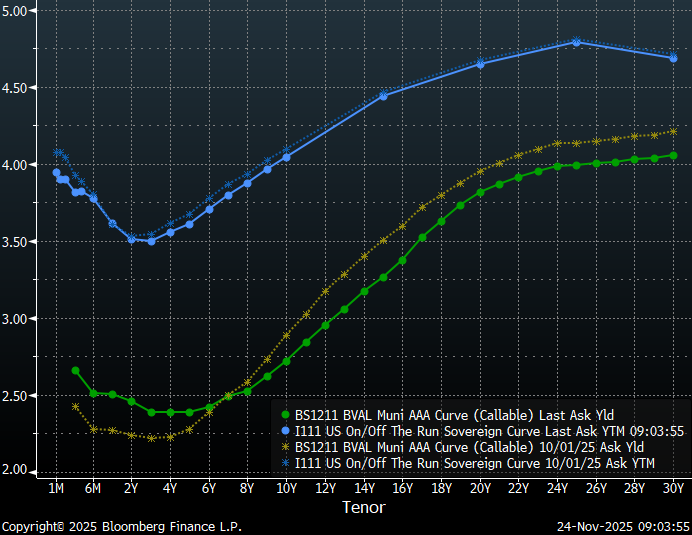
Slopes along the municipal yield curve are currently steepest around the 16-year tenor, with almost 75 bps in slope from 13 to 19-years. This is a significant change from earlier last month, when the steepest slopes were around the 10-year tenor. This shift has increased the reward to investors for extending from the 10-year range to the 15-20-year range. In addition, investors benefit from a steep roll-down over time. Although the municipal yield curve is currently rewarding duration, the long-end has become very flat with steadily declining slopes from 20 to 30-years and only a basis point or so per year past 25-years. As a result of this flat tail, municipal bond investors can buy maturities under 20-years that yield over 90% of the 30-year curve.

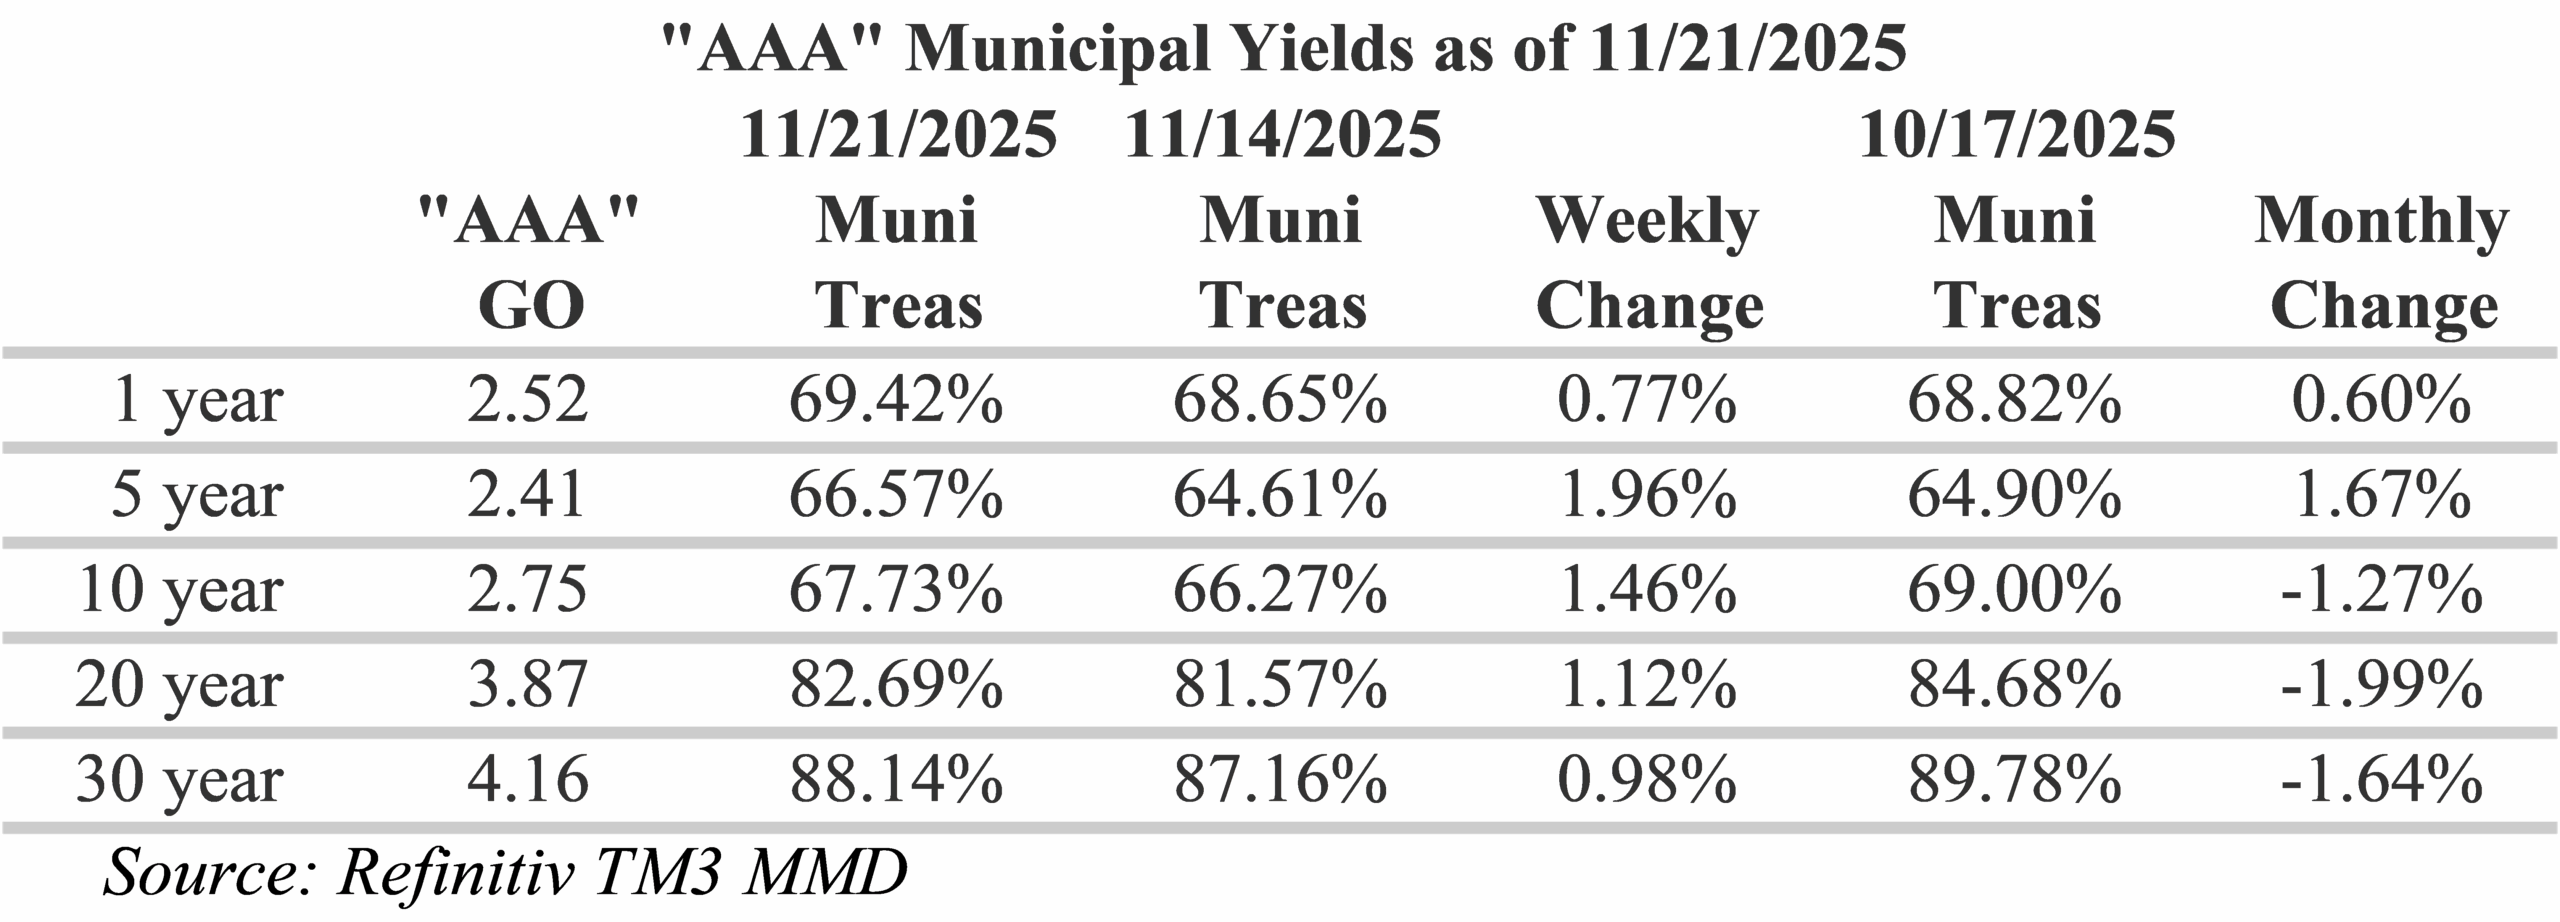
Elevated municipal tax-equivalent yields on the long-end continue to reward investors, with ratios generally cheapening over the past week. The muni/Treasury ratio is a widely watched measure that provides a sense of how tax-exempt munis fare against taxable fixed-income options. Crossover investors, which seek to identify the best opportunities in the fixed income universe on an after-tax basis, closely follow this ratio. Over the past week, the biggest moves have been in maturities around the 5 to 10-year mark where ratios have become almost 2% richer, with ratios now around 66.5% at 5-years. Over the past month, the biggest moves have been around the 20-year maturity where ratios are now about 2% richer. For investors seeking to maximize curve positioning with relative value, extending to the 18-year part of the municipal yield curve provides almost 90% of the 30-year maturity and almost 80% of equivalent Treasury yields.
Last week, the municipal bond market experienced uncharacteristically weak technical conditions as high deal volume was met by the largest outflows since the week ending April 16. Investors pulled $965.8 million from municipal bond mutual funds. This week, state and local governments bond issuance is expected to drop to $1.48b, due to the holiday week, with new issues expected to slow over the month. Notable deals this week include: Pennsylvania Housing Finance Agency selling $275 million and Keller Independent School District/Texas selling $99 million.
Herbert J. Sims & Co. Inc. is a SEC registered broker-dealer, a member of FINRA, SIPC. The information contained herein has been prepared based upon publicly available sources believed to be reliable; however, HJ Sims does not warrant its completeness or accuracy and no independent verification has been made as to its accuracy or completeness. The information contained has been prepared and is distributed solely for informational purposes and is not a solicitation or an offer to buy or sell any security or instrument or to participate in any trading or investment strategy, and is subject to change without notice. All investments include risks. Nothing in this message or report constitutes or should be construed to be accounting, tax, investment or legal advice.